29
/
en
AIzaSyAYiBZKx7MnpbEhh9jyipgxe19OcubqV5w
April 1, 2024
250618
St. Lucia
LCA
true
2
1
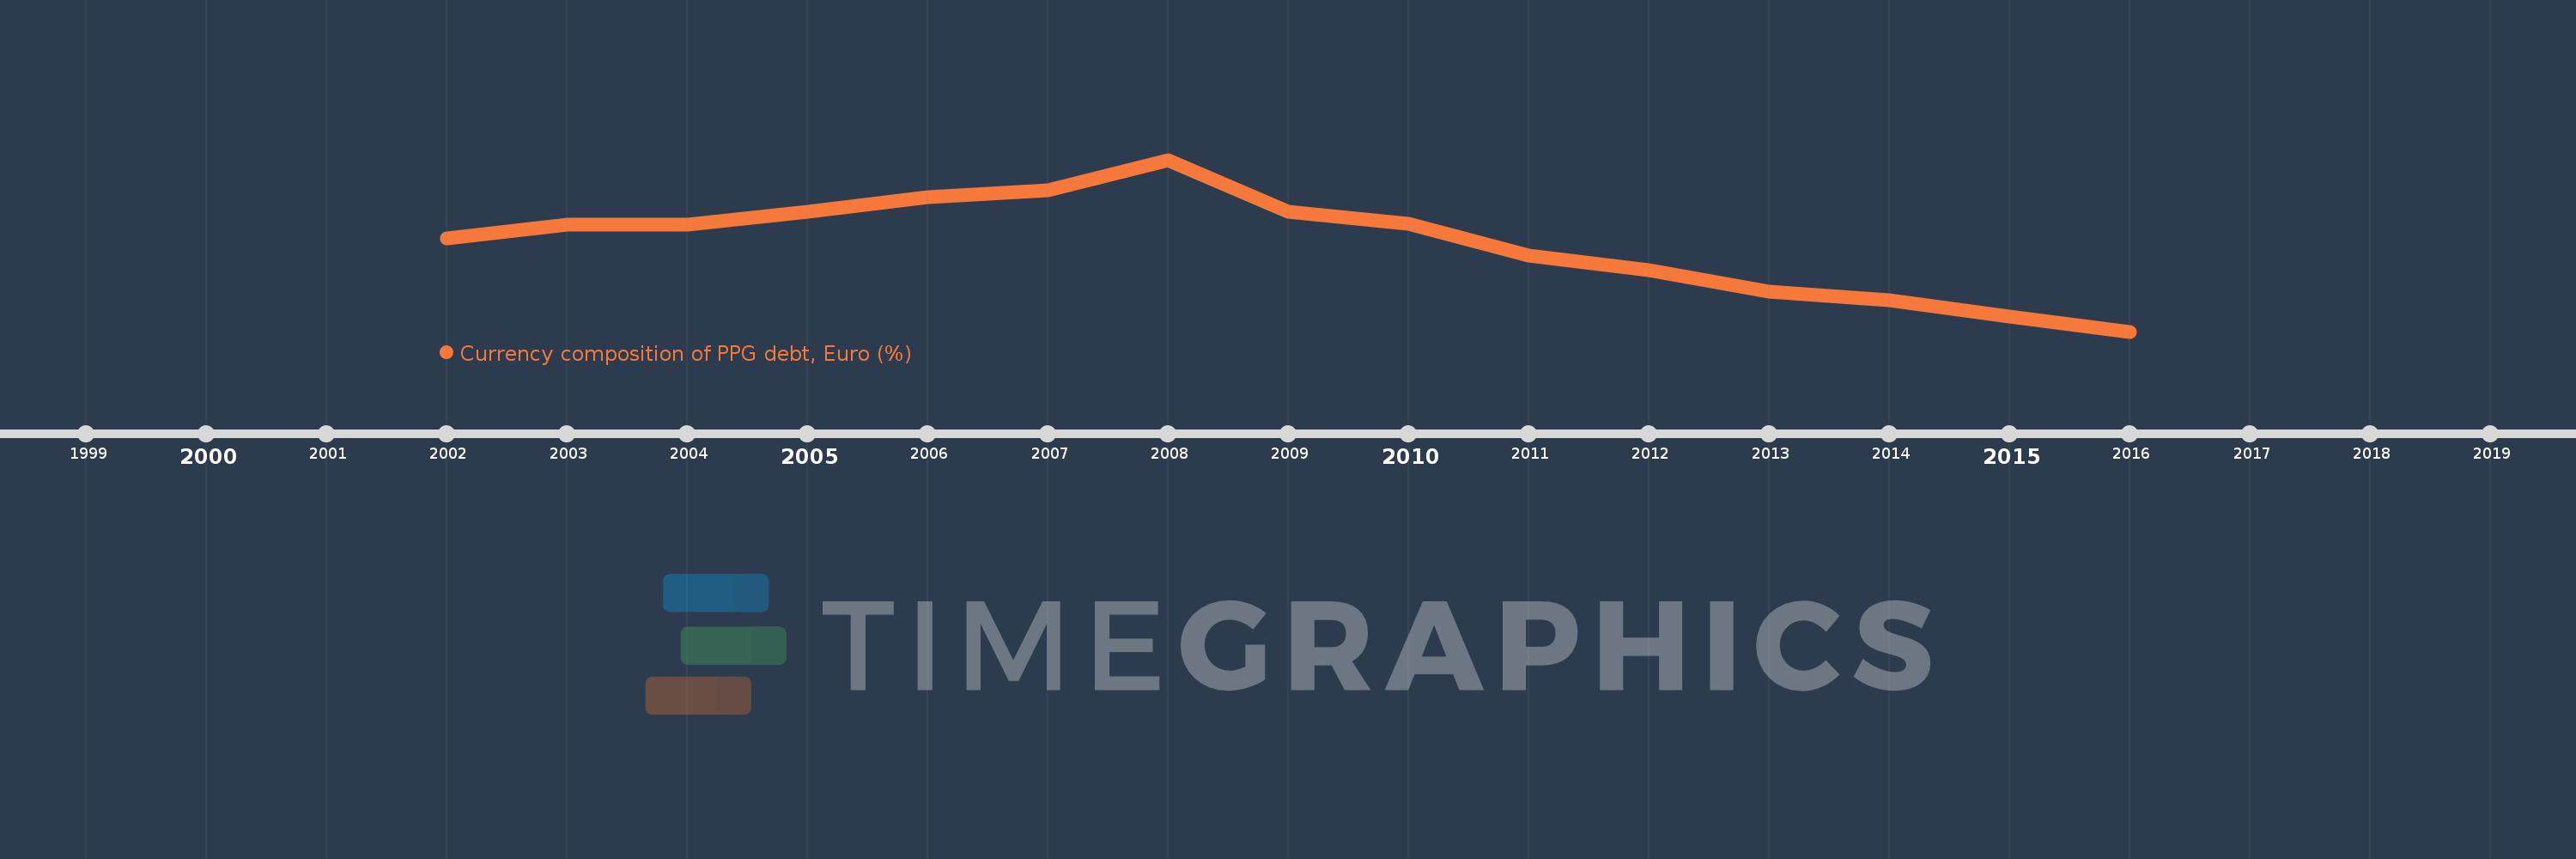
Currency composition of PPG debt, Euro (%)
2016,2015,2014,2013,2012,2011,2010,2009,2008,2007,2006,2005,2004,2003,2002
This statistics in other country:
Timeline:
This timeline shows a graph from 2002 to 2016 of St. Lucia. No data until 2001. Number of actual observations by date: 15.
Source name:
World Development Indicators
Source organization:
World Bank, International Debt Statistics.
Categories, topics:
External Debt
Last updated:
apr 23, 2017
Indicators value changes by year
At the date of observation
Value
Absolute change
Change from previous value
jan 1, 2002
4.989
+4.989
0.0%
jan 1, 2003
5.549
+0.559
11.21%
jan 1, 2004
5.534
-0.014
-0.26%
jan 1, 2005
6.041
+0.506
9.15%
jan 1, 2006
6.612
+0.571
9.45%
jan 1, 2007
6.864
+0.253
3.83%
jan 1, 2008
8.066
+1.202
17.51%
jan 1, 2009
6.027
-2.04
-25.29%
jan 1, 2010
5.574
-0.453
-7.52%
jan 1, 2011
4.335
-1.239
-22.23%
jan 1, 2012
3.755
-0.58
-13.38%
jan 1, 2013
2.918
-0.837
-22.28%
jan 1, 2014
2.593
-0.325
-11.13%
jan 1, 2015
1.954
-0.639
-24.65%
jan 1, 2016
1.365
-0.589
-30.13%
Ranking of countries by current statistics by years


Comments: