29
/
en
AIzaSyAYiBZKx7MnpbEhh9jyipgxe19OcubqV5w
April 1, 2024
244501
Somalia
SOM
true
2
1
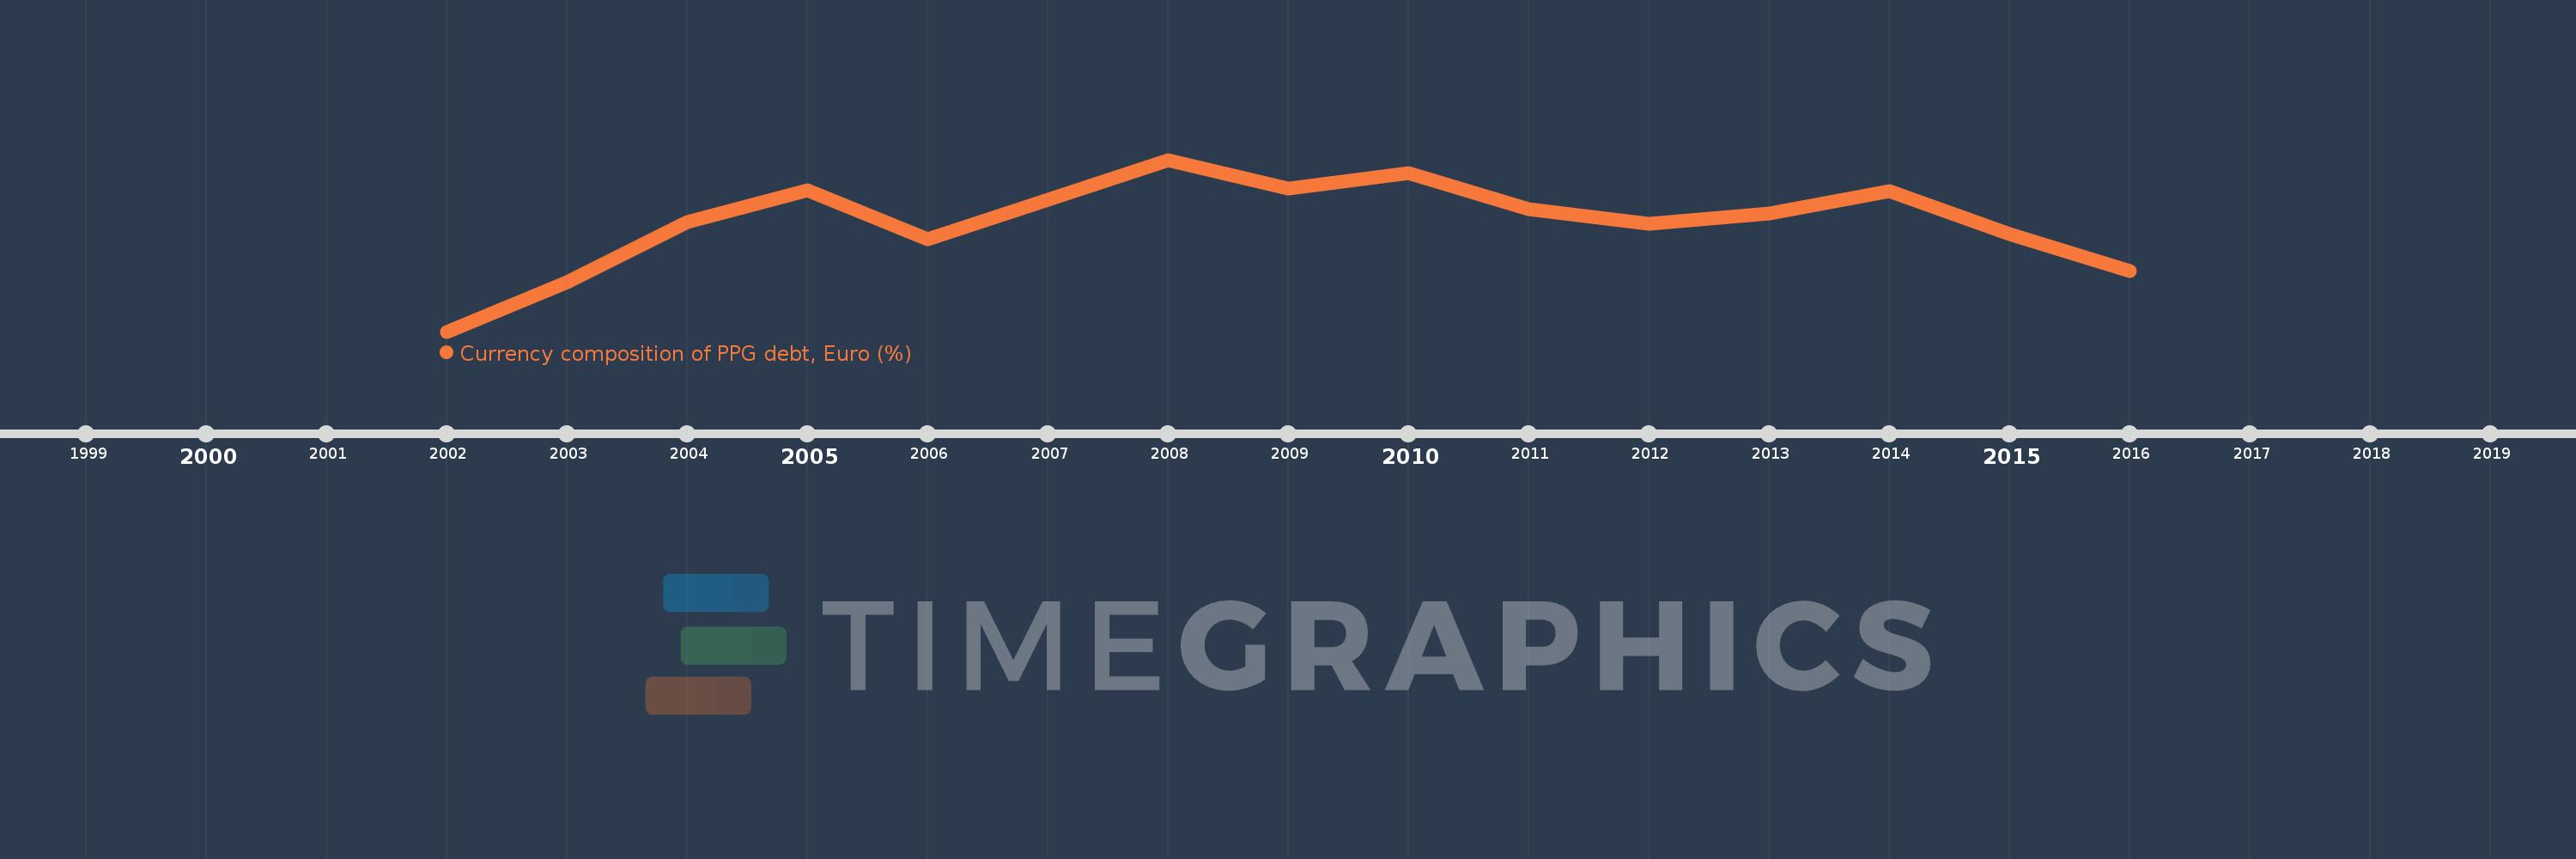
Currency composition of PPG debt, Euro (%)
2016,2015,2014,2013,2012,2011,2010,2009,2008,2007,2006,2005,2004,2003,2002
This statistics in other country:
Timeline:
This timeline shows a graph from 2002 to 2016 of Somalia. No data until 2001. Number of actual observations by date: 15.
Source name:
World Development Indicators
Source organization:
World Bank, International Debt Statistics.
Categories, topics:
External Debt
Last updated:
apr 23, 2017
Indicators value changes by year
At the date of observation
Value
Absolute change
Change from previous value
jan 1, 2002
4.392
+4.392
0.0%
jan 1, 2003
5.037
+0.645
14.68%
jan 1, 2004
5.827
+0.79
15.69%
jan 1, 2005
6.243
+0.416
7.14%
jan 1, 2006
5.601
-0.642
-10.28%
jan 1, 2007
6.12
+0.518
9.26%
jan 1, 2008
6.646
+0.526
8.6%
jan 1, 2009
6.27
-0.376
-5.65%
jan 1, 2010
6.475
+0.205
3.27%
jan 1, 2011
5.998
-0.477
-7.37%
jan 1, 2012
5.804
-0.194
-3.23%
jan 1, 2013
5.939
+0.135
2.32%
jan 1, 2014
6.231
+0.292
4.93%
jan 1, 2015
5.669
-0.563
-9.03%
jan 1, 2016
5.185
-0.484
-8.53%
Ranking of countries by current statistics by years


Comments: