29
/
en
AIzaSyAYiBZKx7MnpbEhh9jyipgxe19OcubqV5w
April 1, 2024
265624
Tonga
TON
true
2
1
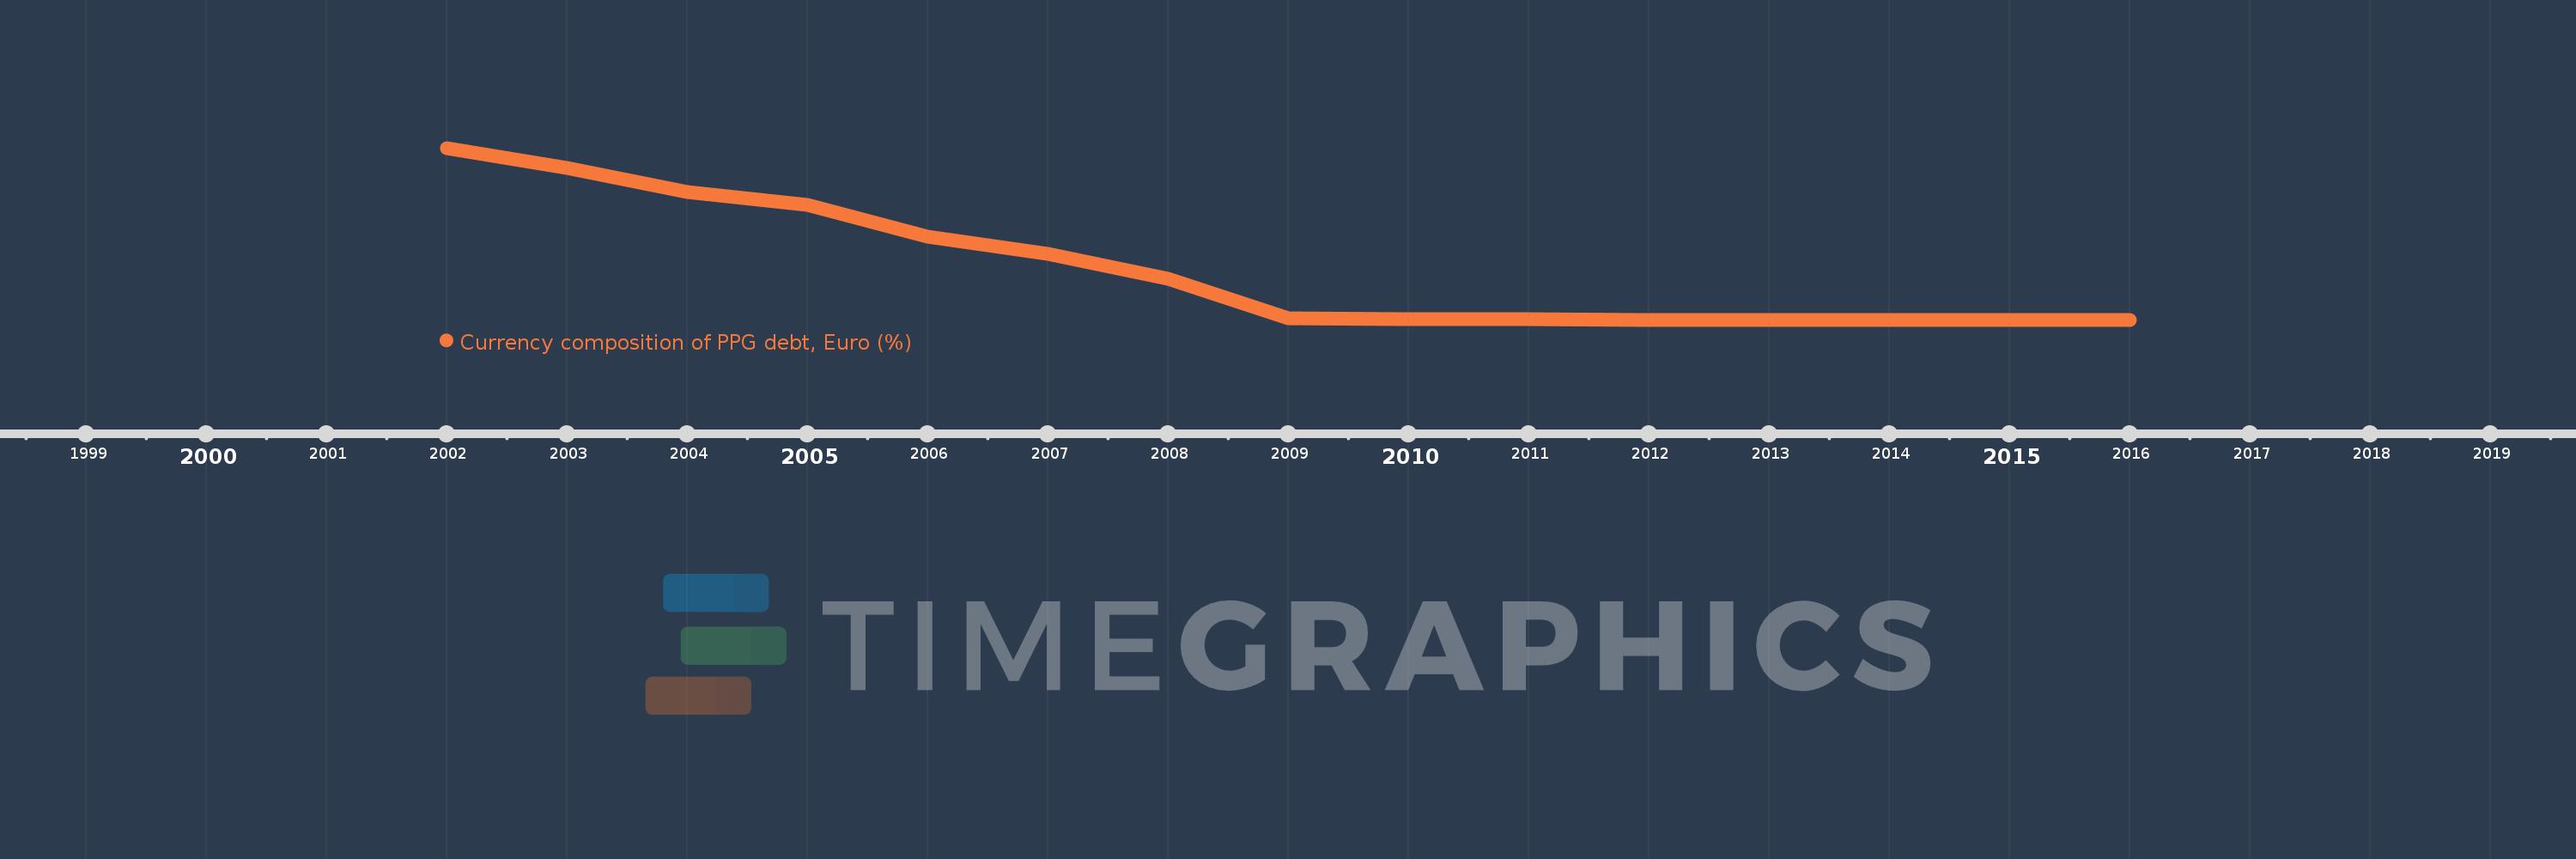
Currency composition of PPG debt, Euro (%)
2016,2015,2014,2013,2012,2011,2010,2009,2008,2007,2006,2005,2004,2003,2002
This statistics in other country:
Timeline:
This timeline shows a graph from 2002 to 2016 of Tonga. No data until 2001. Number of actual observations by date: 15.
Source name:
World Development Indicators
Source organization:
World Bank, International Debt Statistics.
Categories, topics:
External Debt
Last updated:
apr 23, 2017
Indicators value changes by year
At the date of observation
Value
Absolute change
Change from previous value
jan 1, 2002
15.19
+15.19
0.0%
jan 1, 2003
13.402
-1.788
-11.77%
jan 1, 2004
11.269
-2.133
-15.92%
jan 1, 2005
10.15
-1.119
-9.93%
jan 1, 2006
7.343
-2.807
-27.66%
jan 1, 2007
5.806
-1.537
-20.93%
jan 1, 2008
3.649
-2.157
-37.16%
jan 1, 2009
0.125
-3.524
-96.58%
jan 1, 2010
0.083
-0.042
-33.47%
jan 1, 2011
0.038
-0.045
-54.75%
jan 1, 2012
0.015
-0.023
-60.37%
jan 1, 2013
0.0
-0.015
-100.0%
Ranking of countries by current statistics by years


Comments: