29
/
en
AIzaSyAYiBZKx7MnpbEhh9jyipgxe19OcubqV5w
April 1, 2024
64507
Albania
ALB
true
2
1
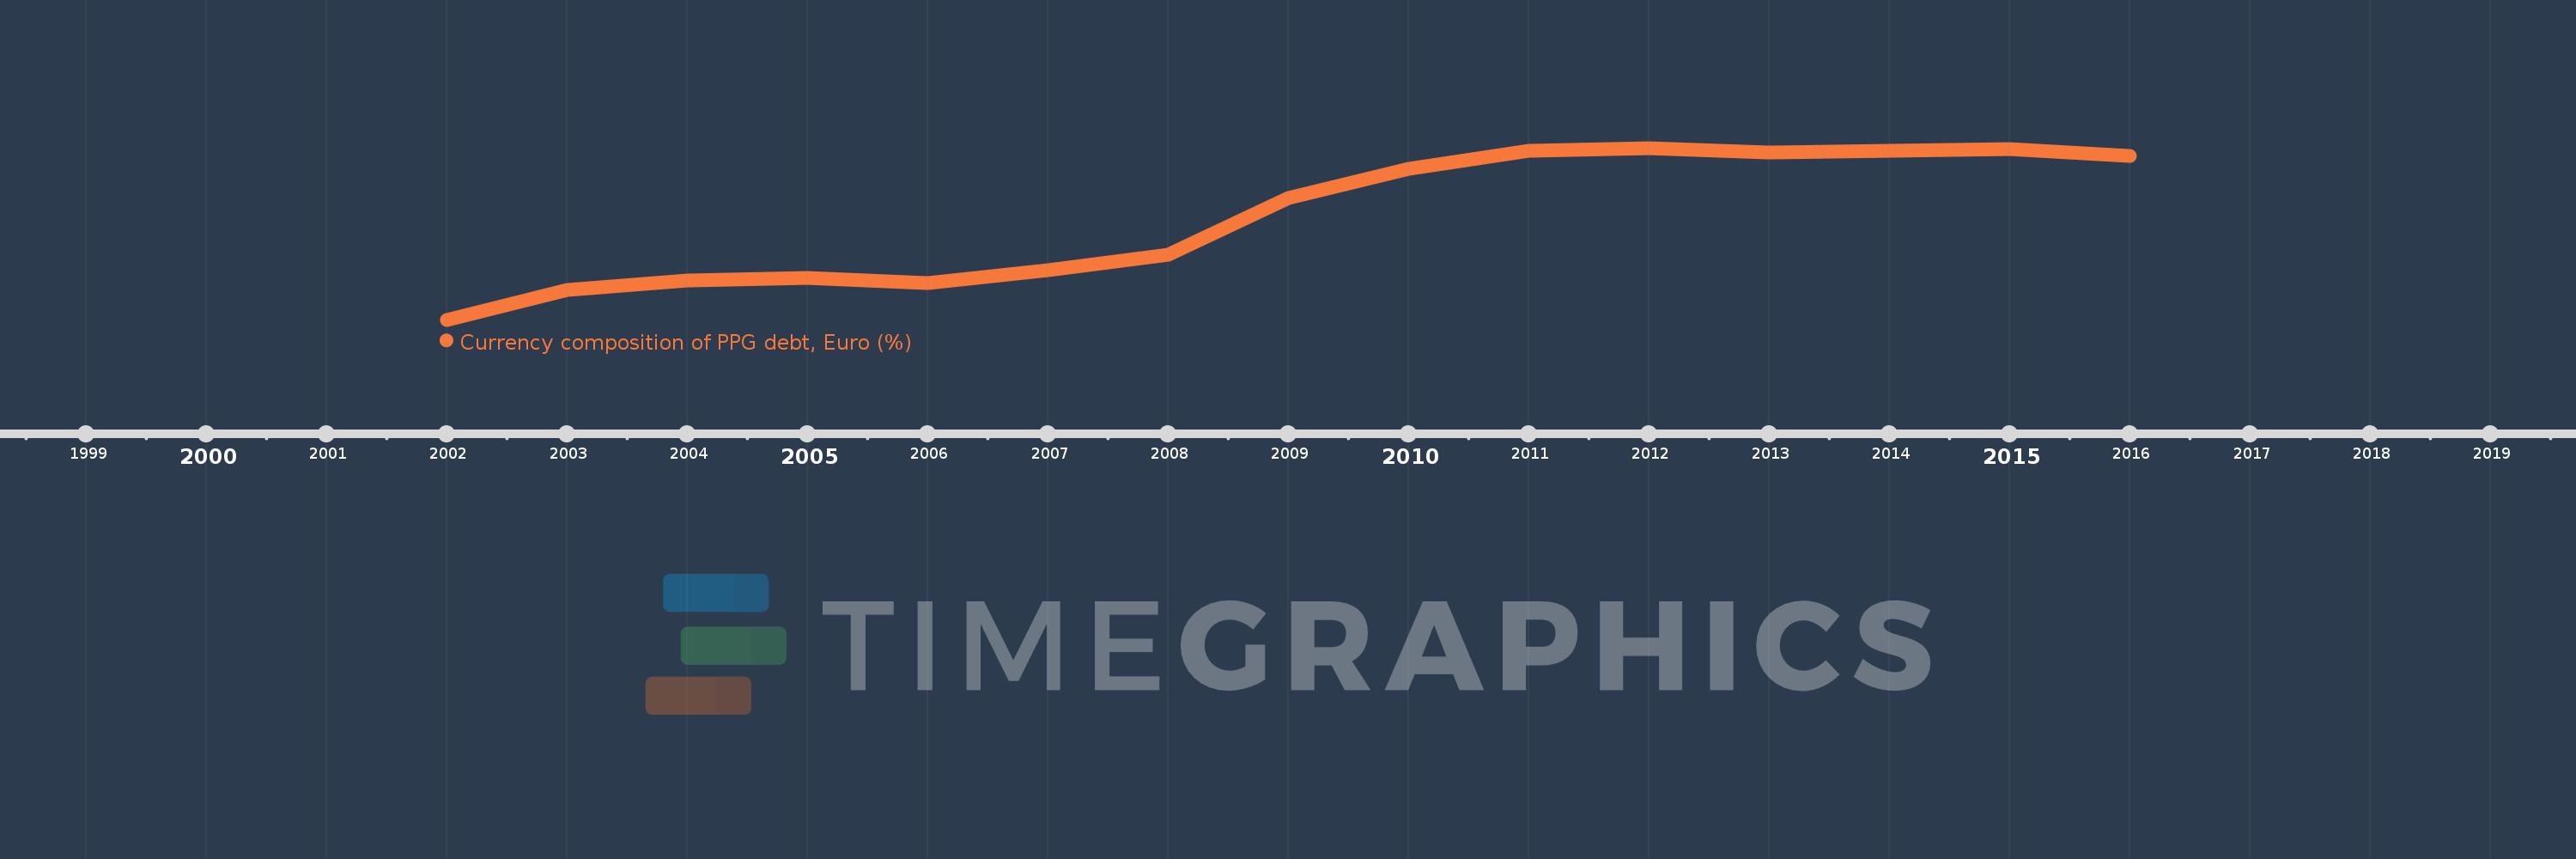
Currency composition of PPG debt, Euro (%)
2016,2015,2014,2013,2012,2011,2010,2009,2008,2007,2006,2005,2004,2003,2002
This statistics in other country:
Timeline:
This timeline shows a graph from 2002 to 2016 of Albania. No data until 2001. Number of actual observations by date: 15.
Source name:
World Development Indicators
Source organization:
World Bank, International Debt Statistics.
Categories, topics:
External Debt
Last updated:
apr 23, 2017
Indicators value changes by year
Minimum:
19.871
jan 1, 2002
Maximum:
60.583
jan 1, 2012
At the date of observation
Value
Absolute change
Change from previous value
jan 1, 2002
19.871
+19.871
0.0%
jan 1, 2003
27.022
+7.151
35.99%
jan 1, 2004
29.084
+2.062
7.63%
jan 1, 2005
29.762
+0.678
2.33%
jan 1, 2006
28.504
-1.259
-4.23%
jan 1, 2007
31.532
+3.029
10.63%
jan 1, 2008
35.342
+3.81
12.08%
jan 1, 2009
48.735
+13.392
37.89%
jan 1, 2010
55.59
+6.855
14.07%
jan 1, 2011
59.844
+4.254
7.65%
jan 1, 2012
60.583
+0.739
1.24%
jan 1, 2013
59.454
-1.129
-1.86%
jan 1, 2014
59.915
+0.46
0.77%
jan 1, 2015
60.231
+0.316
0.53%
jan 1, 2016
58.755
-1.476
-2.45%
Ranking of countries by current statistics by years


Comments: