29
/
en
AIzaSyAYiBZKx7MnpbEhh9jyipgxe19OcubqV5w
April 1, 2024
42233
Latin America & Caribbean (excluding high income)
LAC
false
2
1
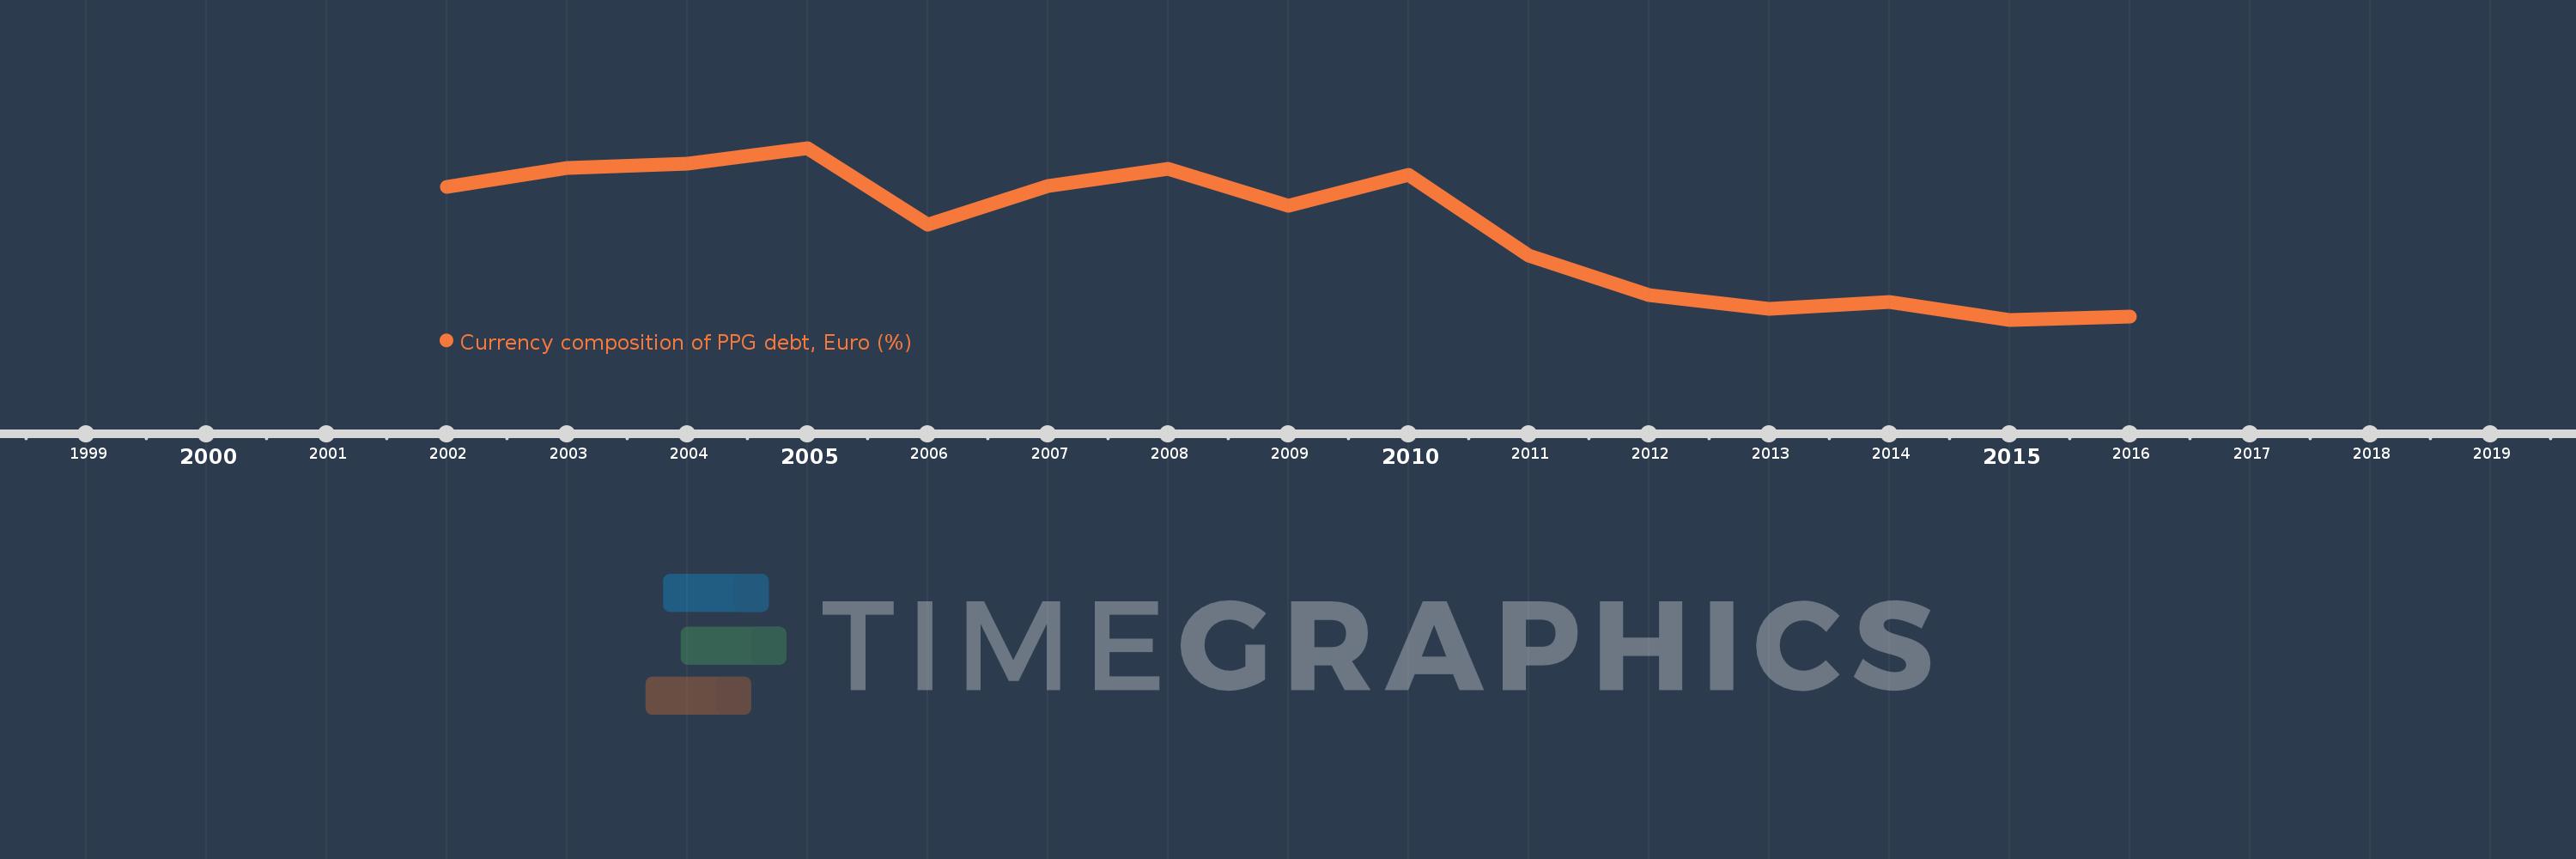
Currency composition of PPG debt, Euro (%)
2016,2015,2014,2013,2012,2011,2010,2009,2008,2007,2006,2005,2004,2003,2002
This statistics in other country:
Timeline:
This timeline shows a graph from 2002 to 2016 of Latin America & Caribbean (excluding high income). No data until 2001. Number of actual observations by date: 15.
Source name:
World Development Indicators
Source organization:
World Bank, International Debt Statistics.
Categories, topics:
External Debt
Last updated:
apr 23, 2017
Indicators value changes by year
Maximum:
11.682
jan 1, 2005
At the date of observation
Value
Absolute change
Change from previous value
jan 1, 2002
10.462
+10.462
0.0%
jan 1, 2003
11.071
+0.609
5.82%
jan 1, 2004
11.179
+0.108
0.98%
jan 1, 2005
11.682
+0.502
4.49%
jan 1, 2006
9.295
-2.387
-20.43%
jan 1, 2007
10.498
+1.203
12.94%
jan 1, 2008
11.044
+0.546
5.2%
jan 1, 2009
9.879
-1.165
-10.55%
jan 1, 2010
10.845
+0.965
9.77%
jan 1, 2011
8.319
-2.526
-23.29%
jan 1, 2012
7.092
-1.227
-14.75%
jan 1, 2013
6.675
-0.417
-5.88%
jan 1, 2014
6.871
+0.197
2.95%
jan 1, 2015
6.325
-0.547
-7.96%
jan 1, 2016
6.42
+0.096
1.52%
Ranking of countries by current statistics by years


Comments: