29
/
en
AIzaSyAYiBZKx7MnpbEhh9jyipgxe19OcubqV5w
April 1, 2024
135355
Gabon
GAB
true
2
1
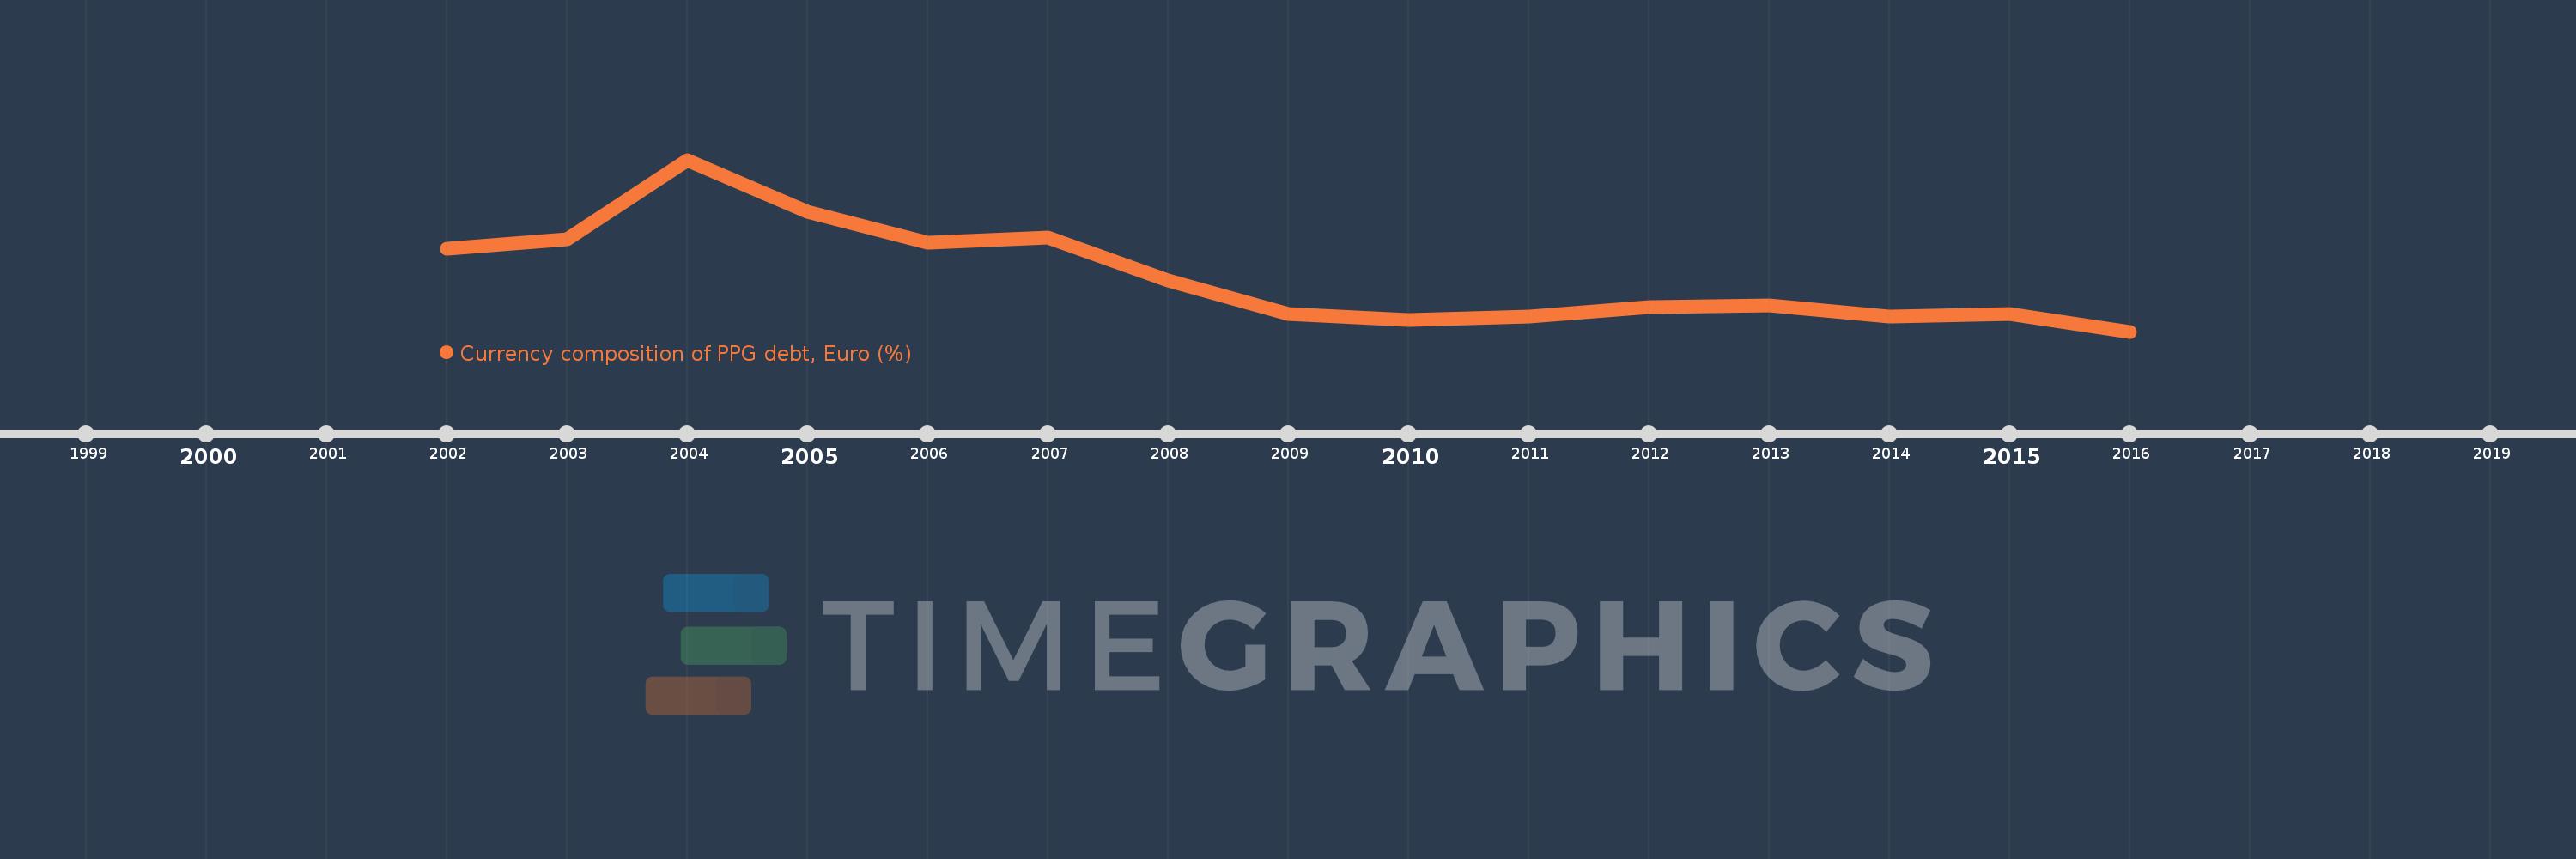
Currency composition of PPG debt, Euro (%)
2016,2015,2014,2013,2012,2011,2010,2009,2008,2007,2006,2005,2004,2003,2002
This statistics in other country:
Timeline:
This timeline shows a graph from 2002 to 2016 of Gabon. No data until 2001. Number of actual observations by date: 15.
Source name:
World Development Indicators
Source organization:
World Bank, International Debt Statistics.
Categories, topics:
External Debt
Last updated:
apr 23, 2017
Indicators value changes by year
Minimum:
20.441
jan 1, 2016
Maximum:
72.607
jan 1, 2004
At the date of observation
Value
Absolute change
Change from previous value
jan 1, 2002
45.563
+45.563
0.0%
jan 1, 2003
48.586
+3.023
6.64%
jan 1, 2004
72.607
+24.021
49.44%
jan 1, 2005
56.863
-15.744
-21.68%
jan 1, 2006
47.517
-9.346
-16.44%
jan 1, 2007
48.924
+1.407
2.96%
jan 1, 2008
35.893
-13.031
-26.64%
jan 1, 2009
25.802
-10.091
-28.11%
jan 1, 2010
23.937
-1.865
-7.23%
jan 1, 2011
25.104
+1.167
4.87%
jan 1, 2012
27.941
+2.837
11.3%
jan 1, 2013
28.434
+0.493
1.77%
jan 1, 2014
25.099
-3.335
-11.73%
jan 1, 2015
25.781
+0.683
2.72%
jan 1, 2016
20.441
-5.34
-20.71%
Ranking of countries by current statistics by years


Comments: