29
/
en
AIzaSyAYiBZKx7MnpbEhh9jyipgxe19OcubqV5w
April 1, 2024
172639
Kyrgyz Republic
KGZ
true
2
1
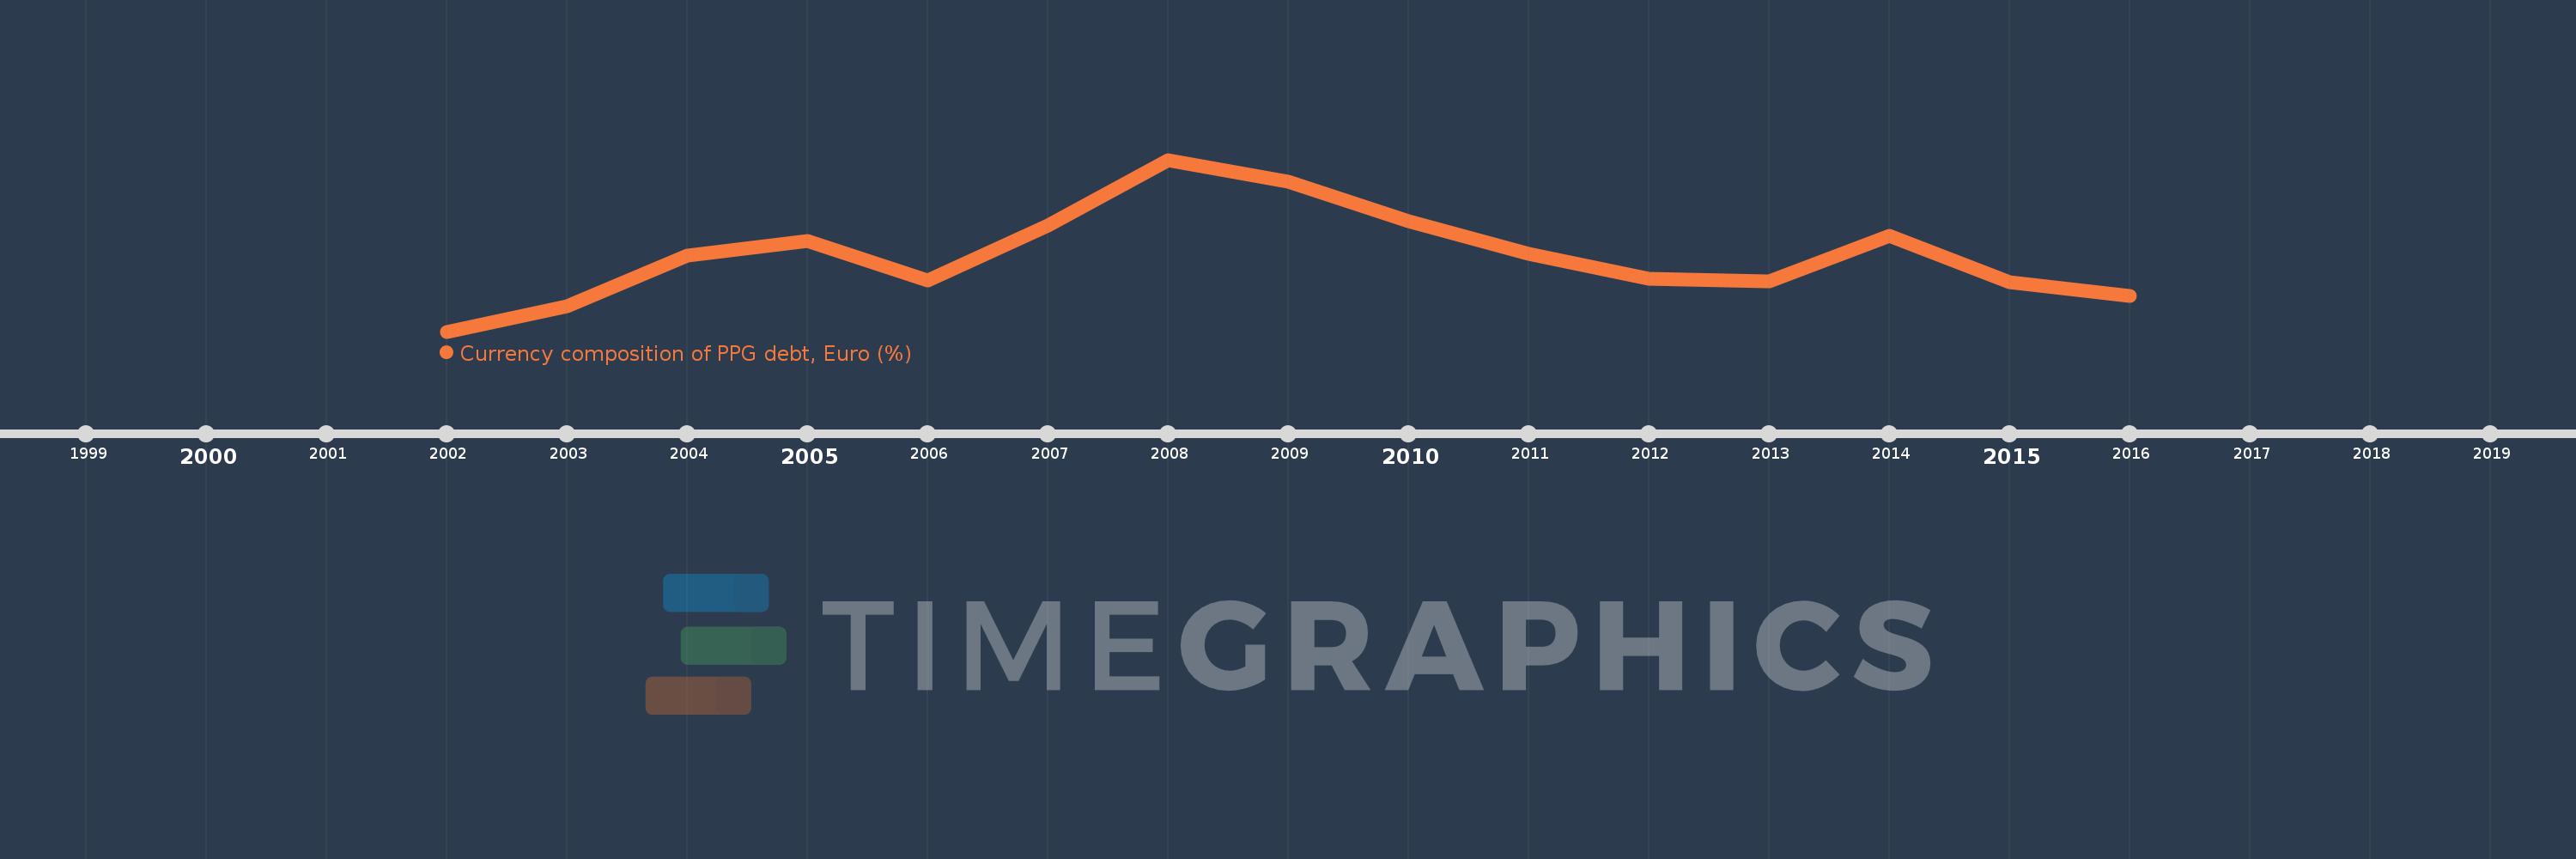
Currency composition of PPG debt, Euro (%)
2016,2015,2014,2013,2012,2011,2010,2009,2008,2007,2006,2005,2004,2003,2002
This statistics in other country:
Timeline:
This timeline shows a graph from 2002 to 2016 of Kyrgyz Republic. No data until 2001. Number of actual observations by date: 15.
Source name:
World Development Indicators
Source organization:
World Bank, International Debt Statistics.
Categories, topics:
External Debt
Last updated:
apr 23, 2017
Indicators value changes by year
At the date of observation
Value
Absolute change
Change from previous value
jan 1, 2002
2.203
+2.203
0.0%
jan 1, 2003
2.511
+0.308
14.0%
jan 1, 2004
3.117
+0.605
24.1%
jan 1, 2005
3.291
+0.174
5.58%
jan 1, 2006
2.816
-0.475
-14.43%
jan 1, 2007
3.479
+0.663
23.56%
jan 1, 2008
4.272
+0.793
22.8%
jan 1, 2009
4.007
-0.266
-6.21%
jan 1, 2010
3.533
-0.474
-11.84%
jan 1, 2011
3.135
-0.397
-11.25%
jan 1, 2012
2.838
-0.297
-9.48%
jan 1, 2013
2.808
-0.03
-1.07%
jan 1, 2014
3.36
+0.552
19.66%
jan 1, 2015
2.8
-0.559
-16.65%
jan 1, 2016
2.628
-0.173
-6.17%
Ranking of countries by current statistics by years


Comments: