29
/
en
AIzaSyAYiBZKx7MnpbEhh9jyipgxe19OcubqV5w
April 1, 2024
56902
South Asia
SAS
false
2
1
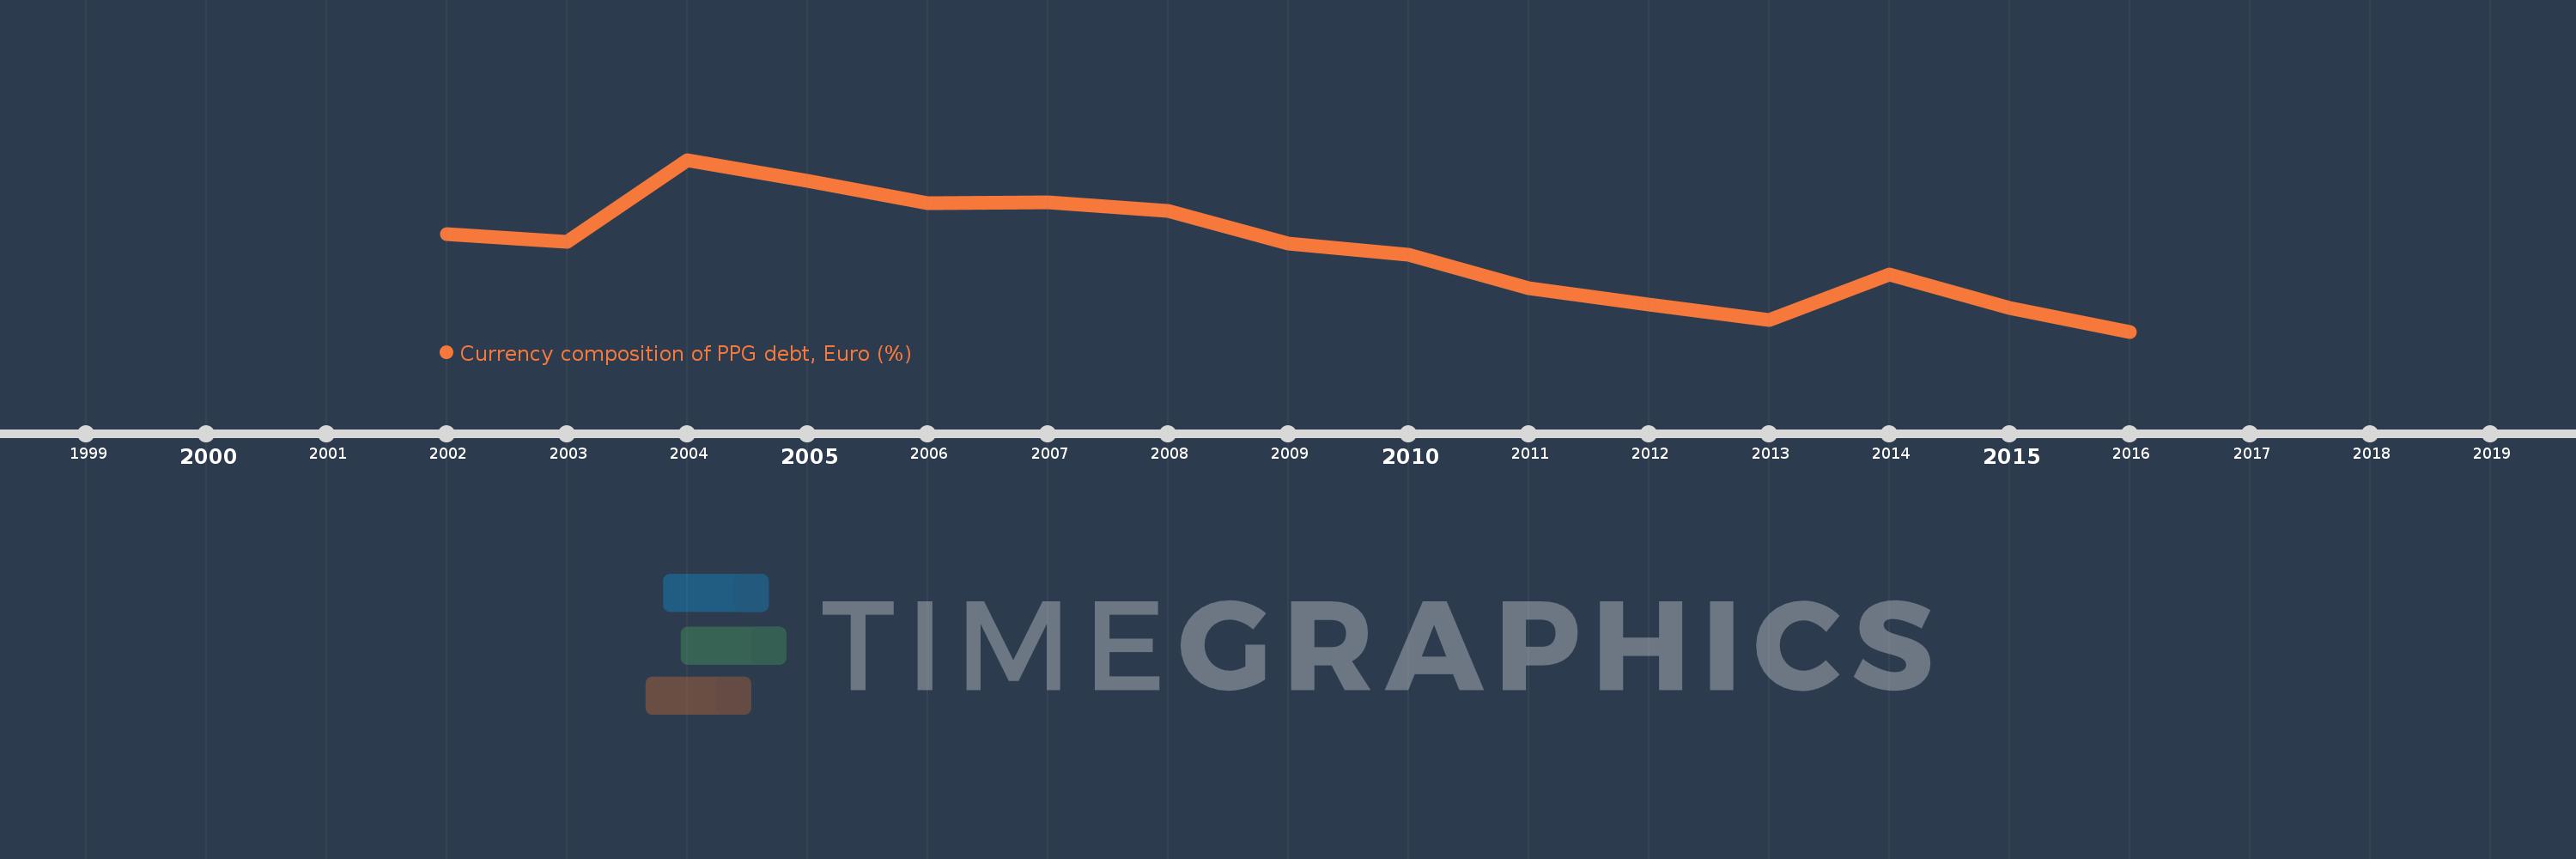
Currency composition of PPG debt, Euro (%)
2016,2015,2014,2013,2012,2011,2010,2009,2008,2007,2006,2005,2004,2003,2002
This statistics in other country:
Timeline:
This timeline shows a graph from 2002 to 2016 of South Asia. No data until 2001. Number of actual observations by date: 15.
Source name:
World Development Indicators
Source organization:
World Bank, International Debt Statistics.
Categories, topics:
External Debt
Last updated:
apr 23, 2017
Indicators value changes by year
At the date of observation
Value
Absolute change
Change from previous value
jan 1, 2002
6.62
+6.62
0.0%
jan 1, 2003
6.423
-0.197
-2.97%
jan 1, 2004
8.69
+2.266
35.29%
jan 1, 2005
8.109
-0.58
-6.68%
jan 1, 2006
7.48
-0.63
-7.76%
jan 1, 2007
7.508
+0.028
0.37%
jan 1, 2008
7.271
-0.236
-3.14%
jan 1, 2009
6.358
-0.914
-12.56%
jan 1, 2010
6.053
-0.305
-4.8%
jan 1, 2011
5.128
-0.925
-15.28%
jan 1, 2012
4.671
-0.457
-8.91%
jan 1, 2013
4.255
-0.416
-8.91%
jan 1, 2014
5.498
+1.243
29.22%
jan 1, 2015
4.579
-0.919
-16.72%
jan 1, 2016
3.922
-0.657
-14.34%
Ranking of countries by current statistics by years


Comments: