29
/
en
AIzaSyAYiBZKx7MnpbEhh9jyipgxe19OcubqV5w
April 1, 2024
275124
United Arab Emirates
ARE
true
2
1
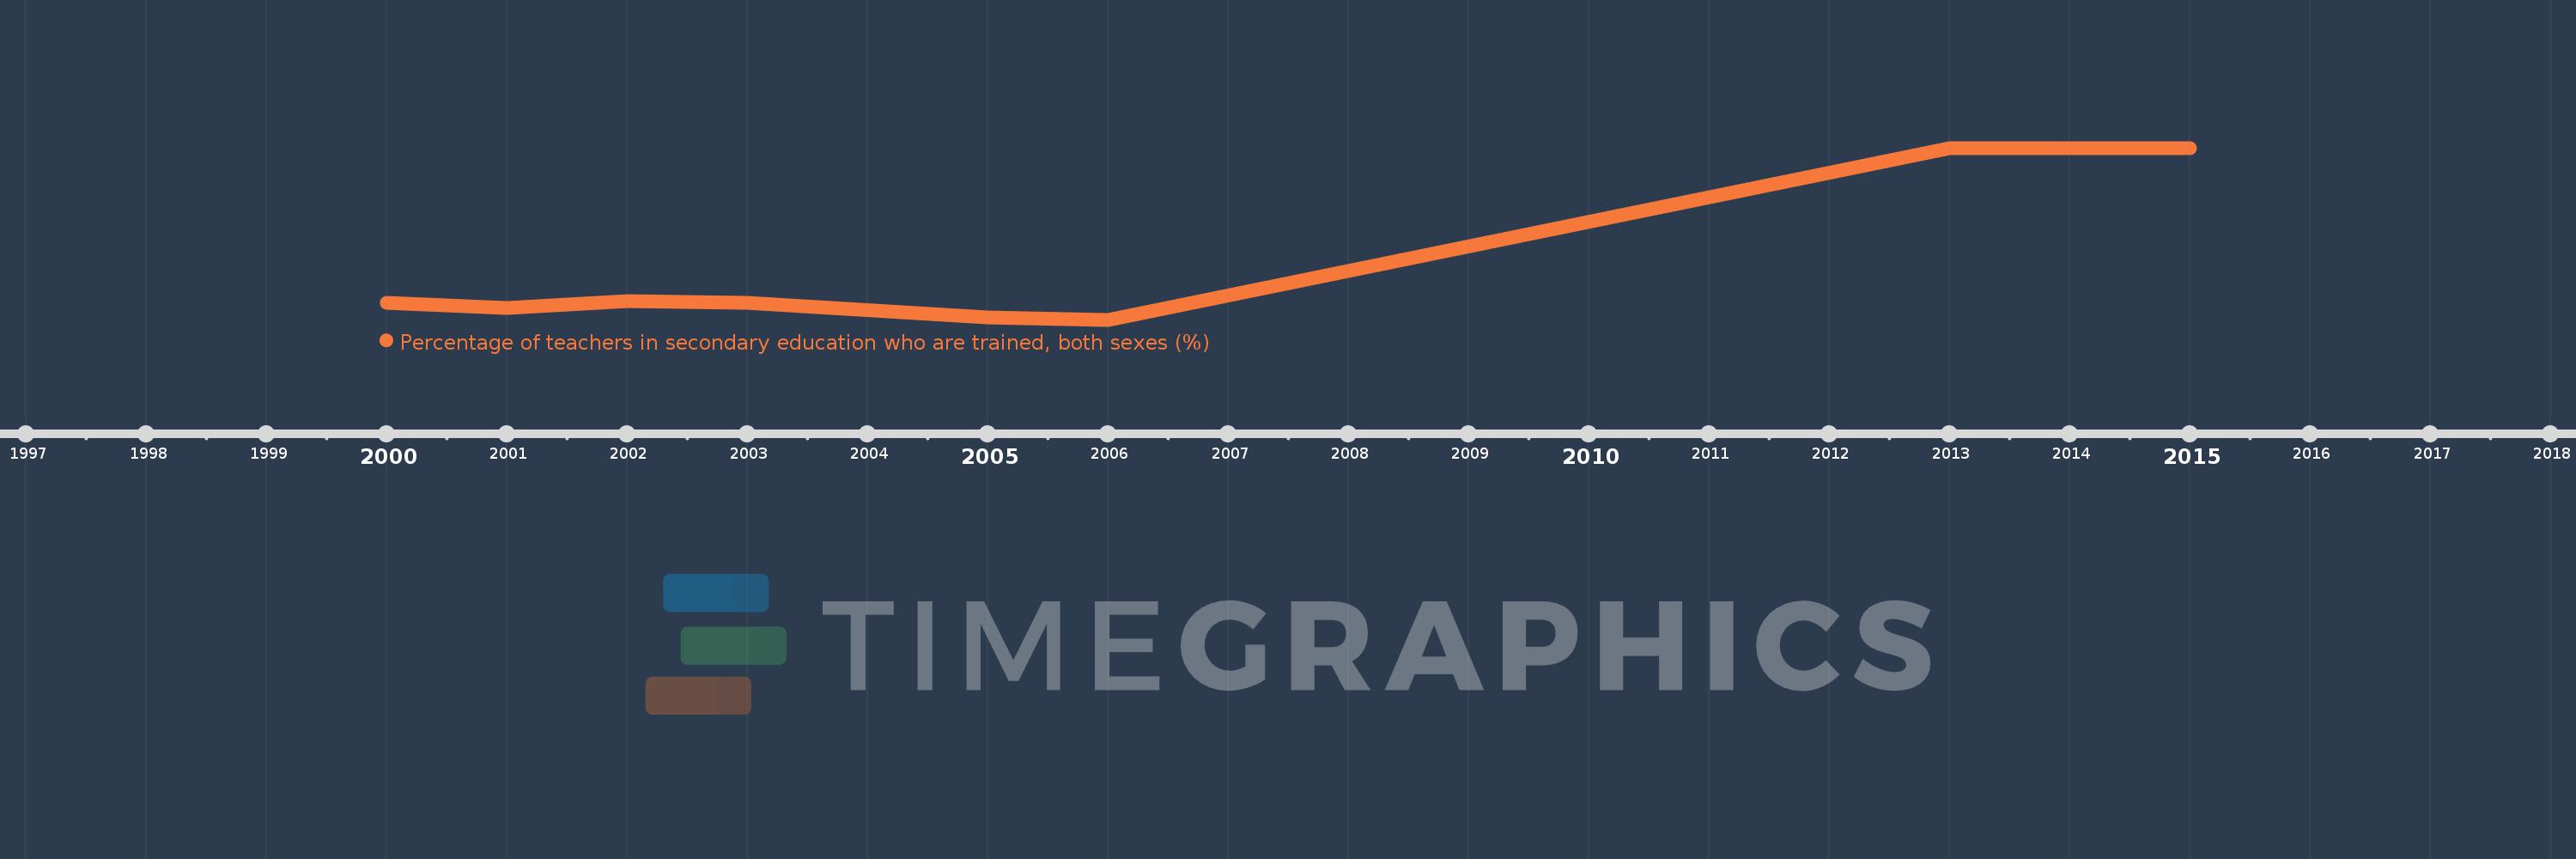
Percentage of teachers in secondary education who are trained, both sexes (%)
2015,2014,2013,2006,2005,2003,2002,2001,2000
This statistics in other country:
Timeline:
This timeline shows a graph from 2000 to 2015 of United Arab Emirates. No data until 1999. Number of actual observations by date: 9.
Source name:
World Development Indicators
Source organization:
UNESCO Institute for Statistics
Categories, topics:
Education
Last updated:
apr 23, 2017
Indicators value changes by year
Minimum:
46.433
jan 1, 2006
At the date of observation
Value
Absolute change
Change from previous value
jan 1, 2000
51.687
+51.687
0.0%
jan 1, 2001
50.192
-1.495
-2.89%
jan 1, 2002
52.307
+2.115
4.21%
jan 1, 2003
51.649
-0.658
-1.26%
jan 1, 2005
47.063
-4.586
-8.88%
jan 1, 2006
46.433
-0.63
-1.34%
jan 1, 2013
100.0
+53.567
115.37%
jan 1, 2014
100.0
0.0
0.0%
jan 1, 2015
100.0
0.0
0.0%
Ranking of countries by current statistics by years


Comments: