29
/
en
AIzaSyAYiBZKx7MnpbEhh9jyipgxe19OcubqV5w
April 1, 2024
238629
Seychelles
SYC
true
2
1
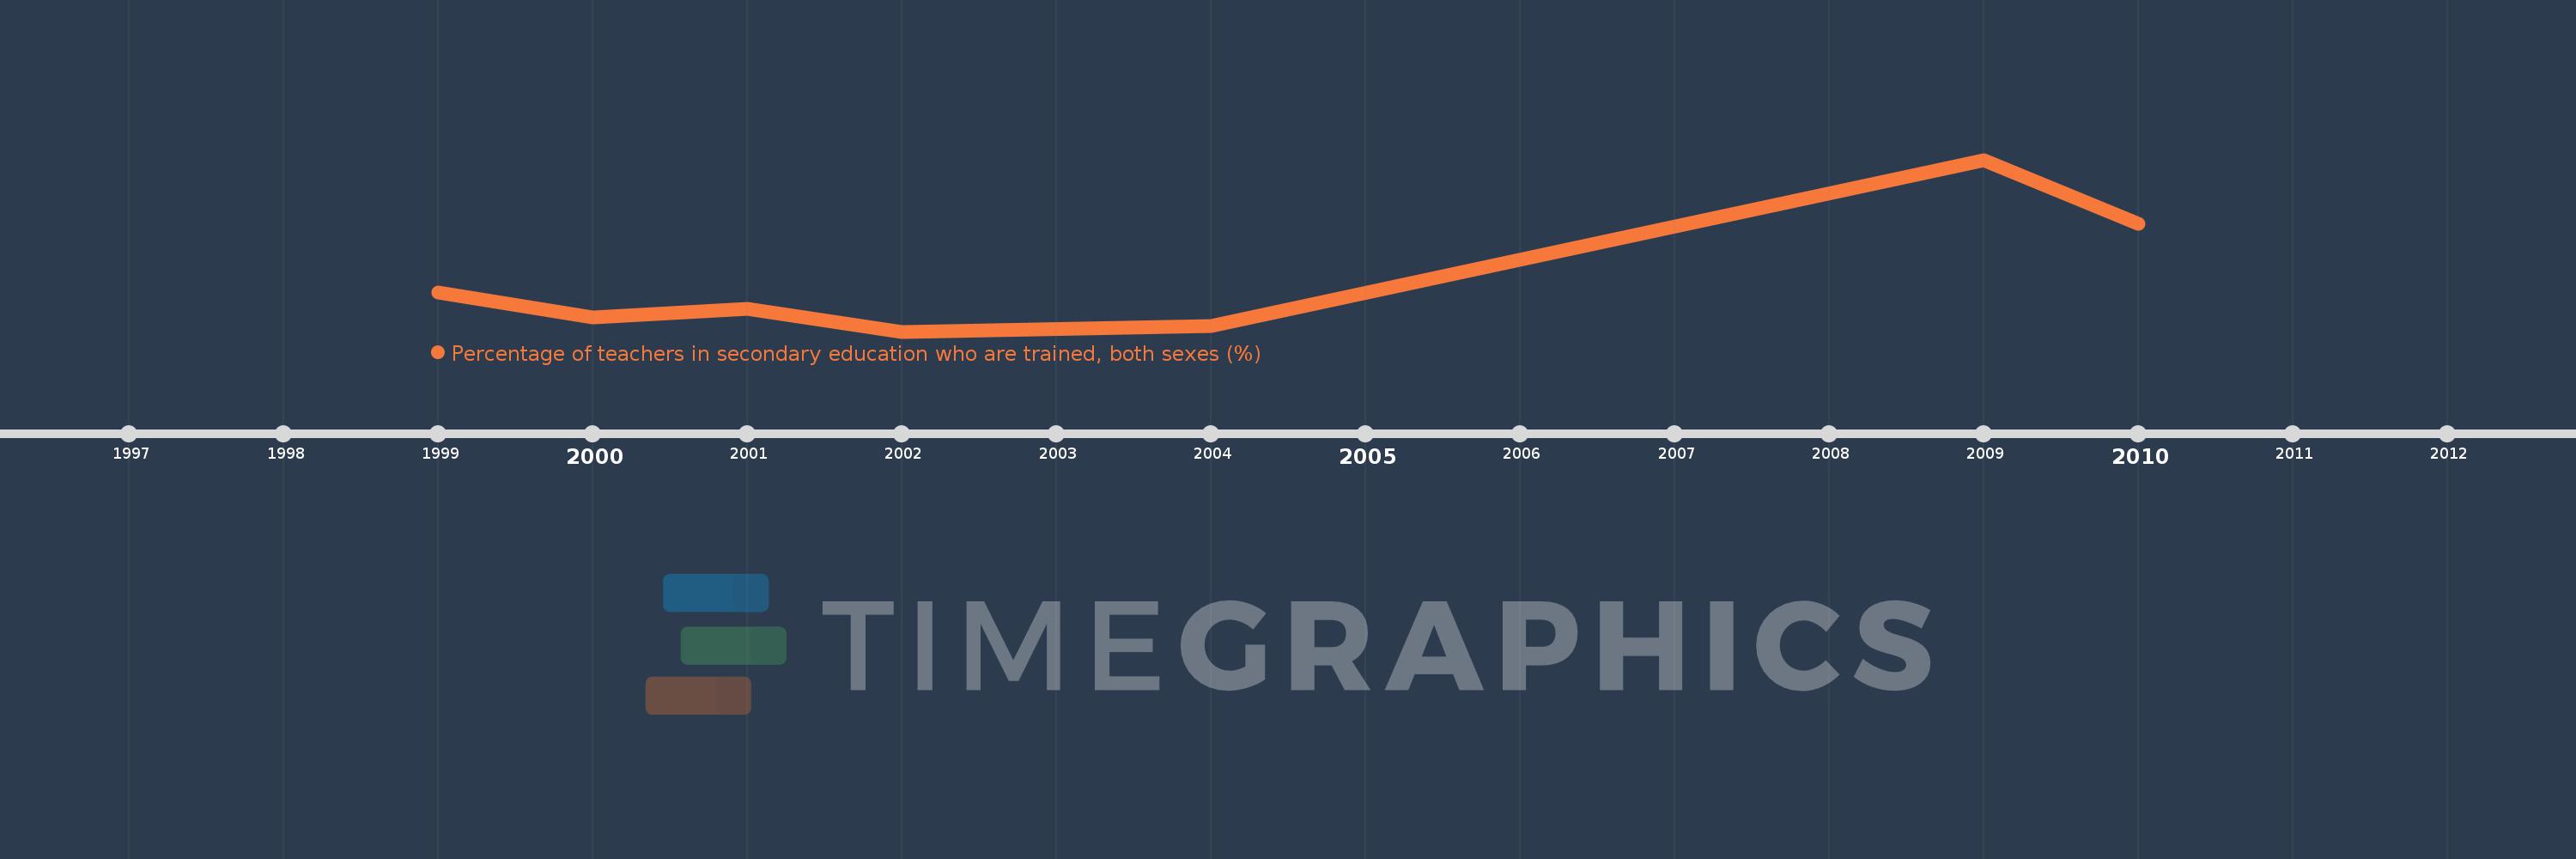
Percentage of teachers in secondary education who are trained, both sexes (%)
2010,2009,2004,2002,2001,2000,1999
This statistics in other country:
Timeline:
This timeline shows a graph from 1999 to 2010 of Seychelles. No data until 1998. Number of actual observations by date: 7.
Source name:
World Development Indicators
Source organization:
UNESCO Institute for Statistics
Categories, topics:
Education
Last updated:
apr 23, 2017
Indicators value changes by year
Minimum:
84.381
jan 1, 2002
Maximum:
98.537
jan 1, 2009
At the date of observation
Value
Absolute change
Change from previous value
jan 1, 1999
87.568
+87.568
0.0%
jan 1, 2000
85.544
-2.023
-2.31%
jan 1, 2001
86.268
+0.723
0.85%
jan 1, 2002
84.381
-1.887
-2.19%
jan 1, 2004
84.874
+0.493
0.58%
jan 1, 2009
98.537
+13.664
16.1%
jan 1, 2010
93.289
-5.249
-5.33%
Ranking of countries by current statistics by years


Comments: