29
/
en
AIzaSyAYiBZKx7MnpbEhh9jyipgxe19OcubqV5w
April 1, 2024
140865
Ghana
GHA
true
2
1
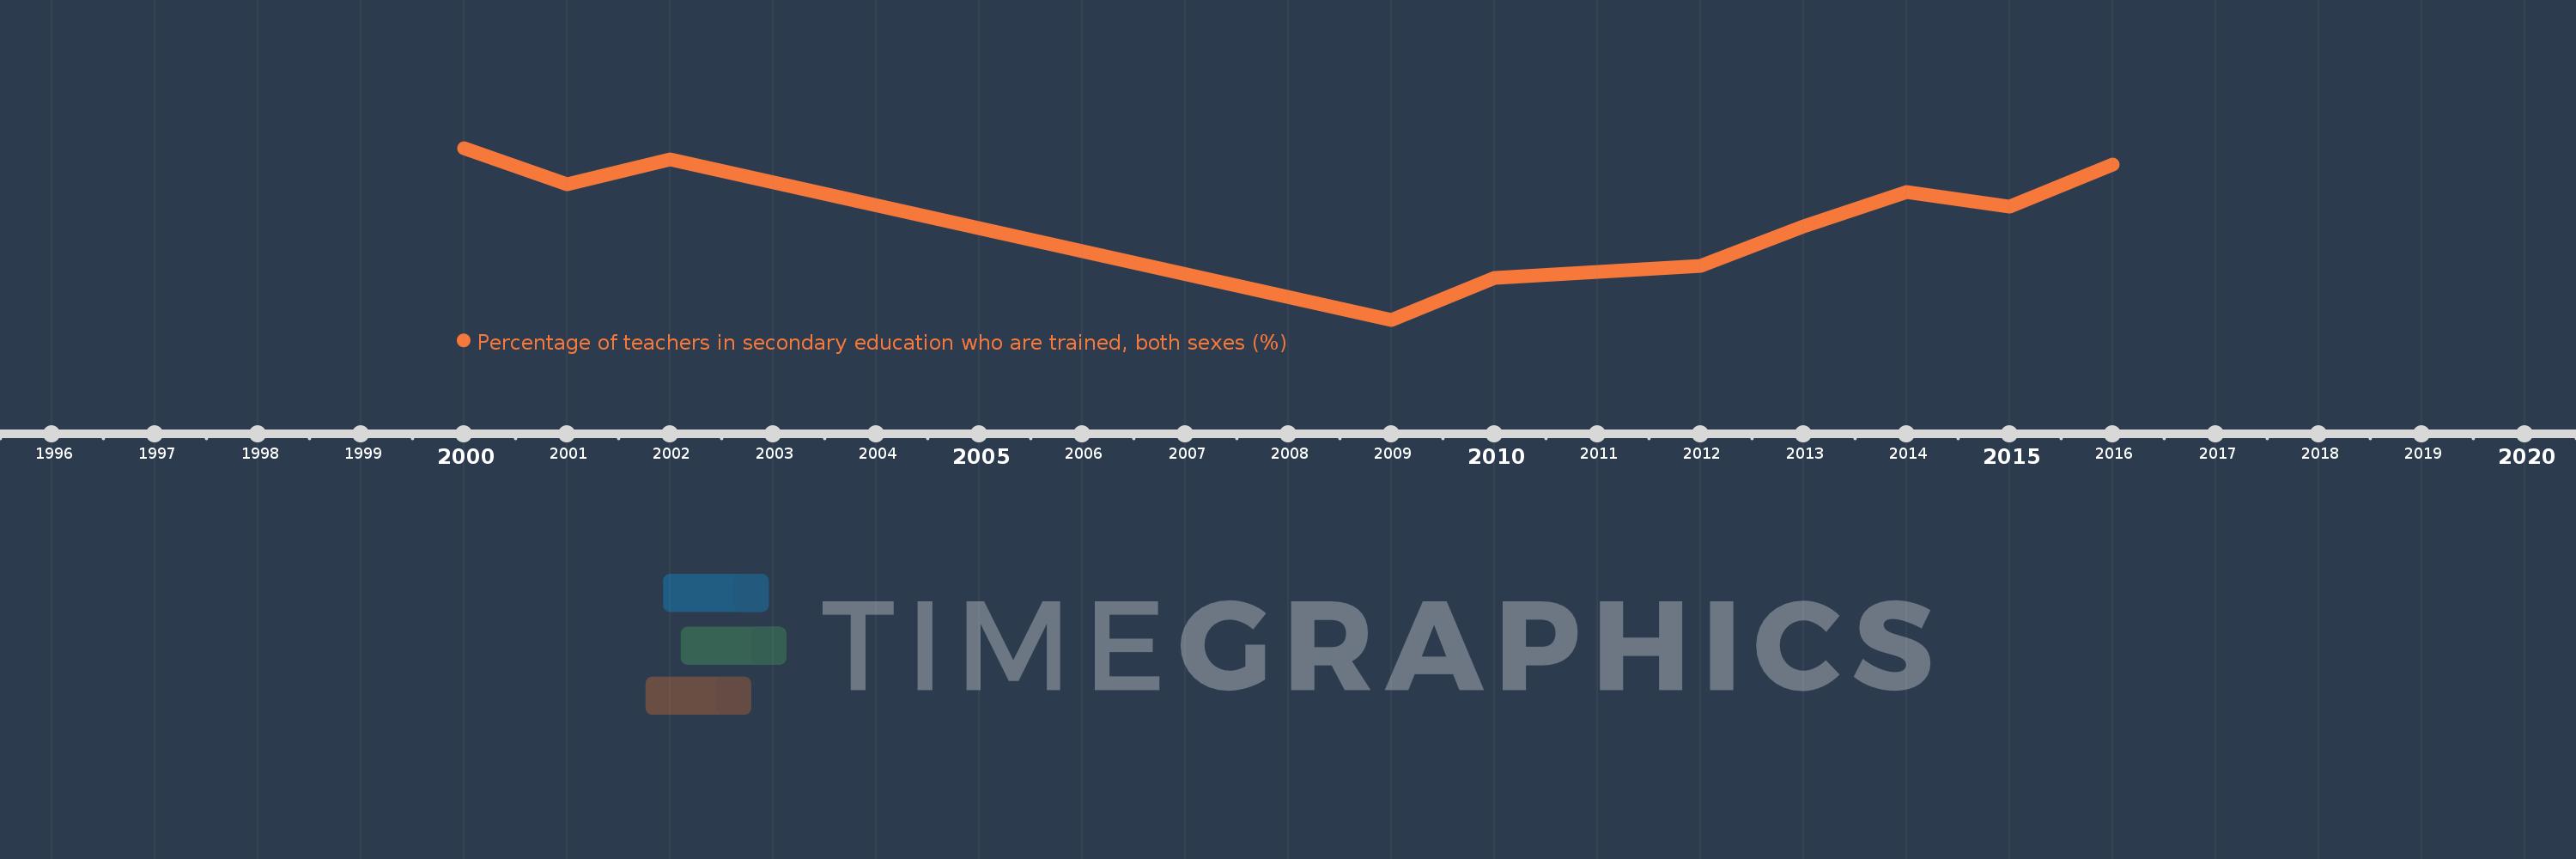
Percentage of teachers in secondary education who are trained, both sexes (%)
2016,2015,2014,2013,2012,2010,2009,2002,2001,2000
This statistics in other country:
Timeline:
This timeline shows a graph from 2000 to 2016 of Ghana. No data until 1999. Number of actual observations by date: 10.
Source name:
World Development Indicators
Source organization:
UNESCO Institute for Statistics
Categories, topics:
Education
Last updated:
apr 23, 2017
Indicators value changes by year
Minimum:
68.677
jan 1, 2009
Maximum:
74.207
jan 1, 2000
At the date of observation
Value
Absolute change
Change from previous value
jan 1, 2000
74.207
+74.207
0.0%
jan 1, 2001
73.034
-1.173
-1.58%
jan 1, 2002
73.834
+0.8
1.1%
jan 1, 2009
68.677
-5.157
-6.98%
jan 1, 2010
70.037
+1.359
1.98%
jan 1, 2012
70.413
+0.376
0.54%
jan 1, 2013
71.692
+1.28
1.82%
jan 1, 2014
72.779
+1.087
1.52%
jan 1, 2015
72.309
-0.471
-0.65%
jan 1, 2016
73.677
+1.369
1.89%
Ranking of countries by current statistics by years


Comments: