29
/
en
AIzaSyAYiBZKx7MnpbEhh9jyipgxe19OcubqV5w
April 1, 2024
53711
Other small states
OSS
false
2
1
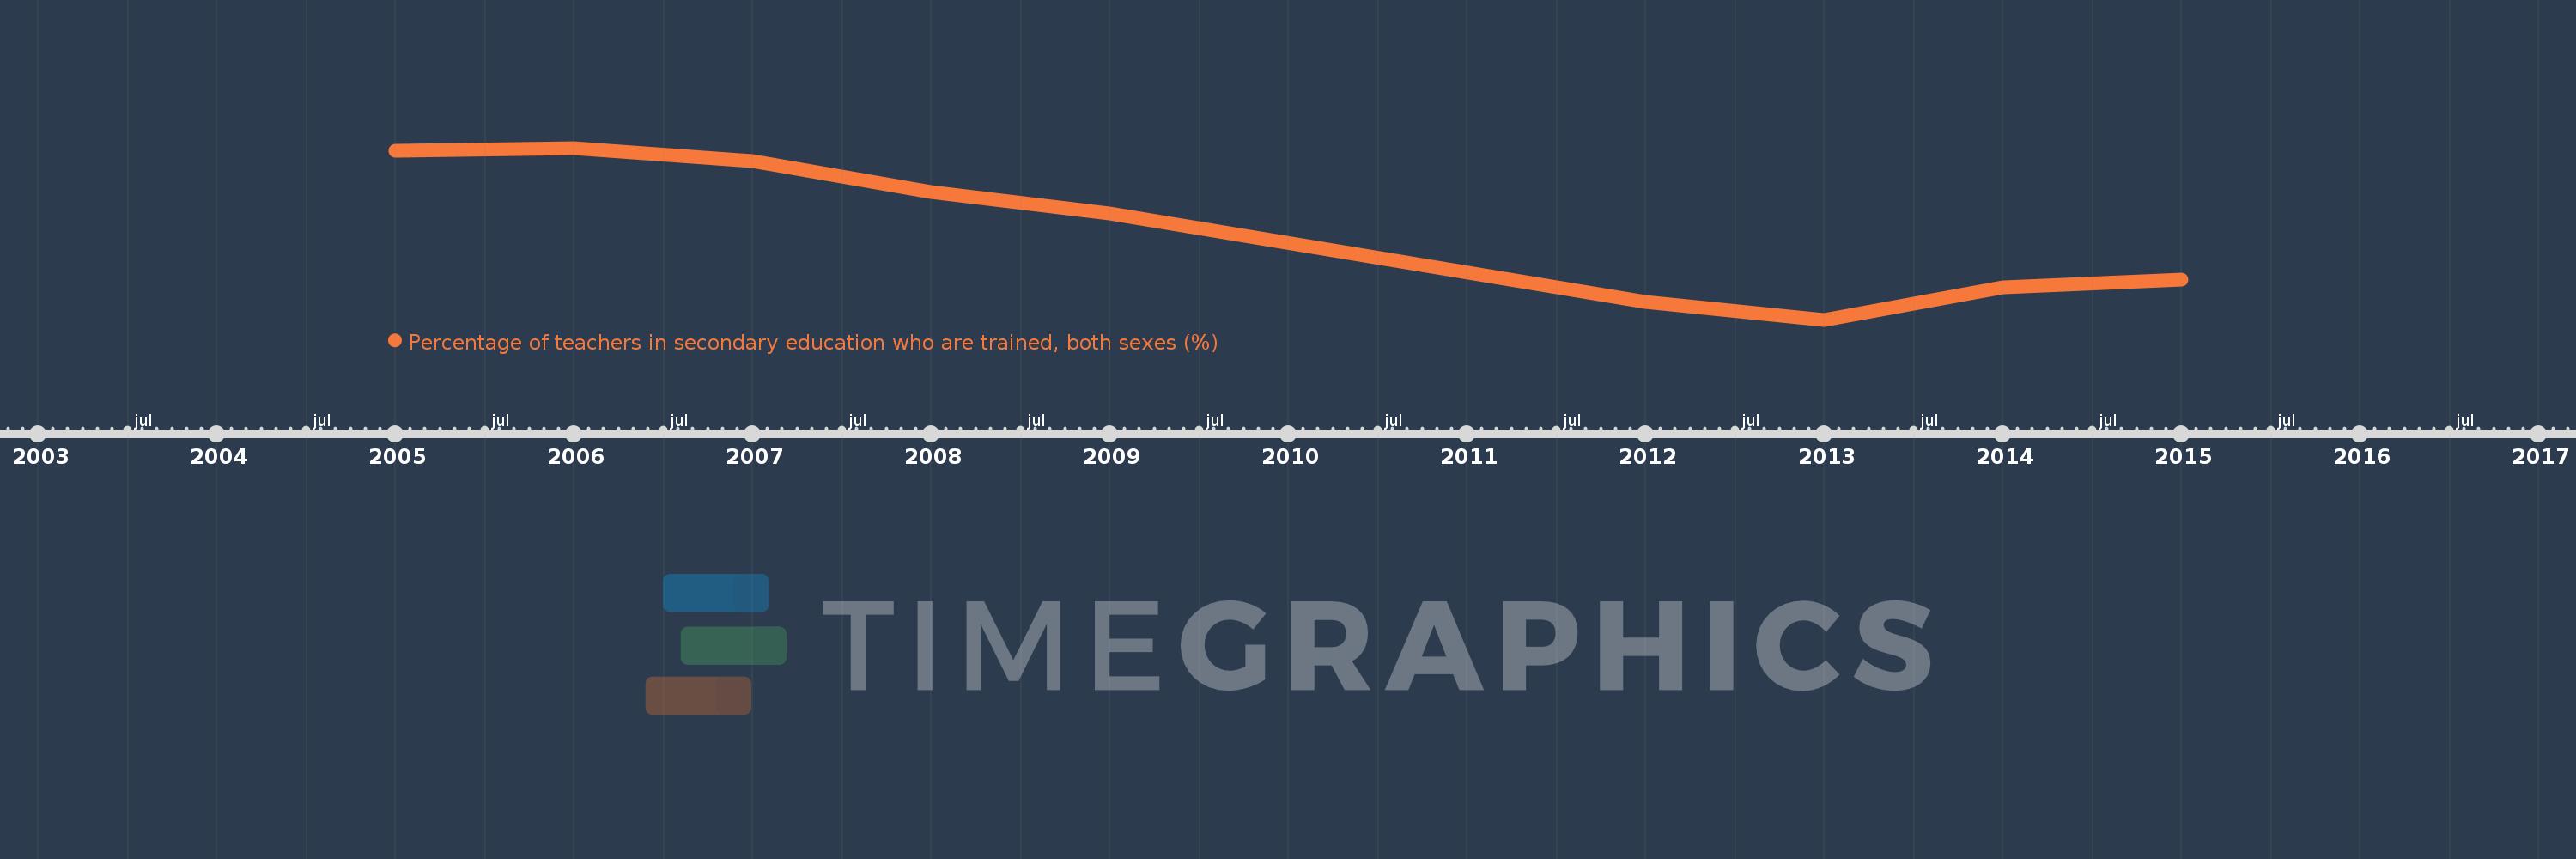
Percentage of teachers in secondary education who are trained, both sexes (%)
2015,2014,2013,2012,2009,2008,2007,2006,2005
This statistics in other country:
Timeline:
This timeline shows a graph from 2005 to 2015 of Other small states. No data until 2004. Number of actual observations by date: 9.
Source name:
World Development Indicators
Source organization:
UNESCO Institute for Statistics
Categories, topics:
Education
Last updated:
apr 23, 2017
Indicators value changes by year
Minimum:
71.672
jan 1, 2013
Maximum:
86.641
jan 1, 2006
At the date of observation
Value
Absolute change
Change from previous value
jan 1, 2005
86.363
+86.363
0.0%
jan 1, 2006
86.641
+0.278
0.32%
jan 1, 2007
85.522
-1.119
-1.29%
jan 1, 2008
82.83
-2.692
-3.15%
jan 1, 2009
80.944
-1.886
-2.28%
jan 1, 2012
73.247
-7.697
-9.51%
jan 1, 2013
71.672
-1.575
-2.15%
jan 1, 2014
74.458
+2.786
3.89%
jan 1, 2015
75.199
+0.742
1.0%
Ranking of countries by current statistics by years


Comments: