29
/
en
AIzaSyAYiBZKx7MnpbEhh9jyipgxe19OcubqV5w
April 1, 2024
205694
Namibia
NAM
true
2
1
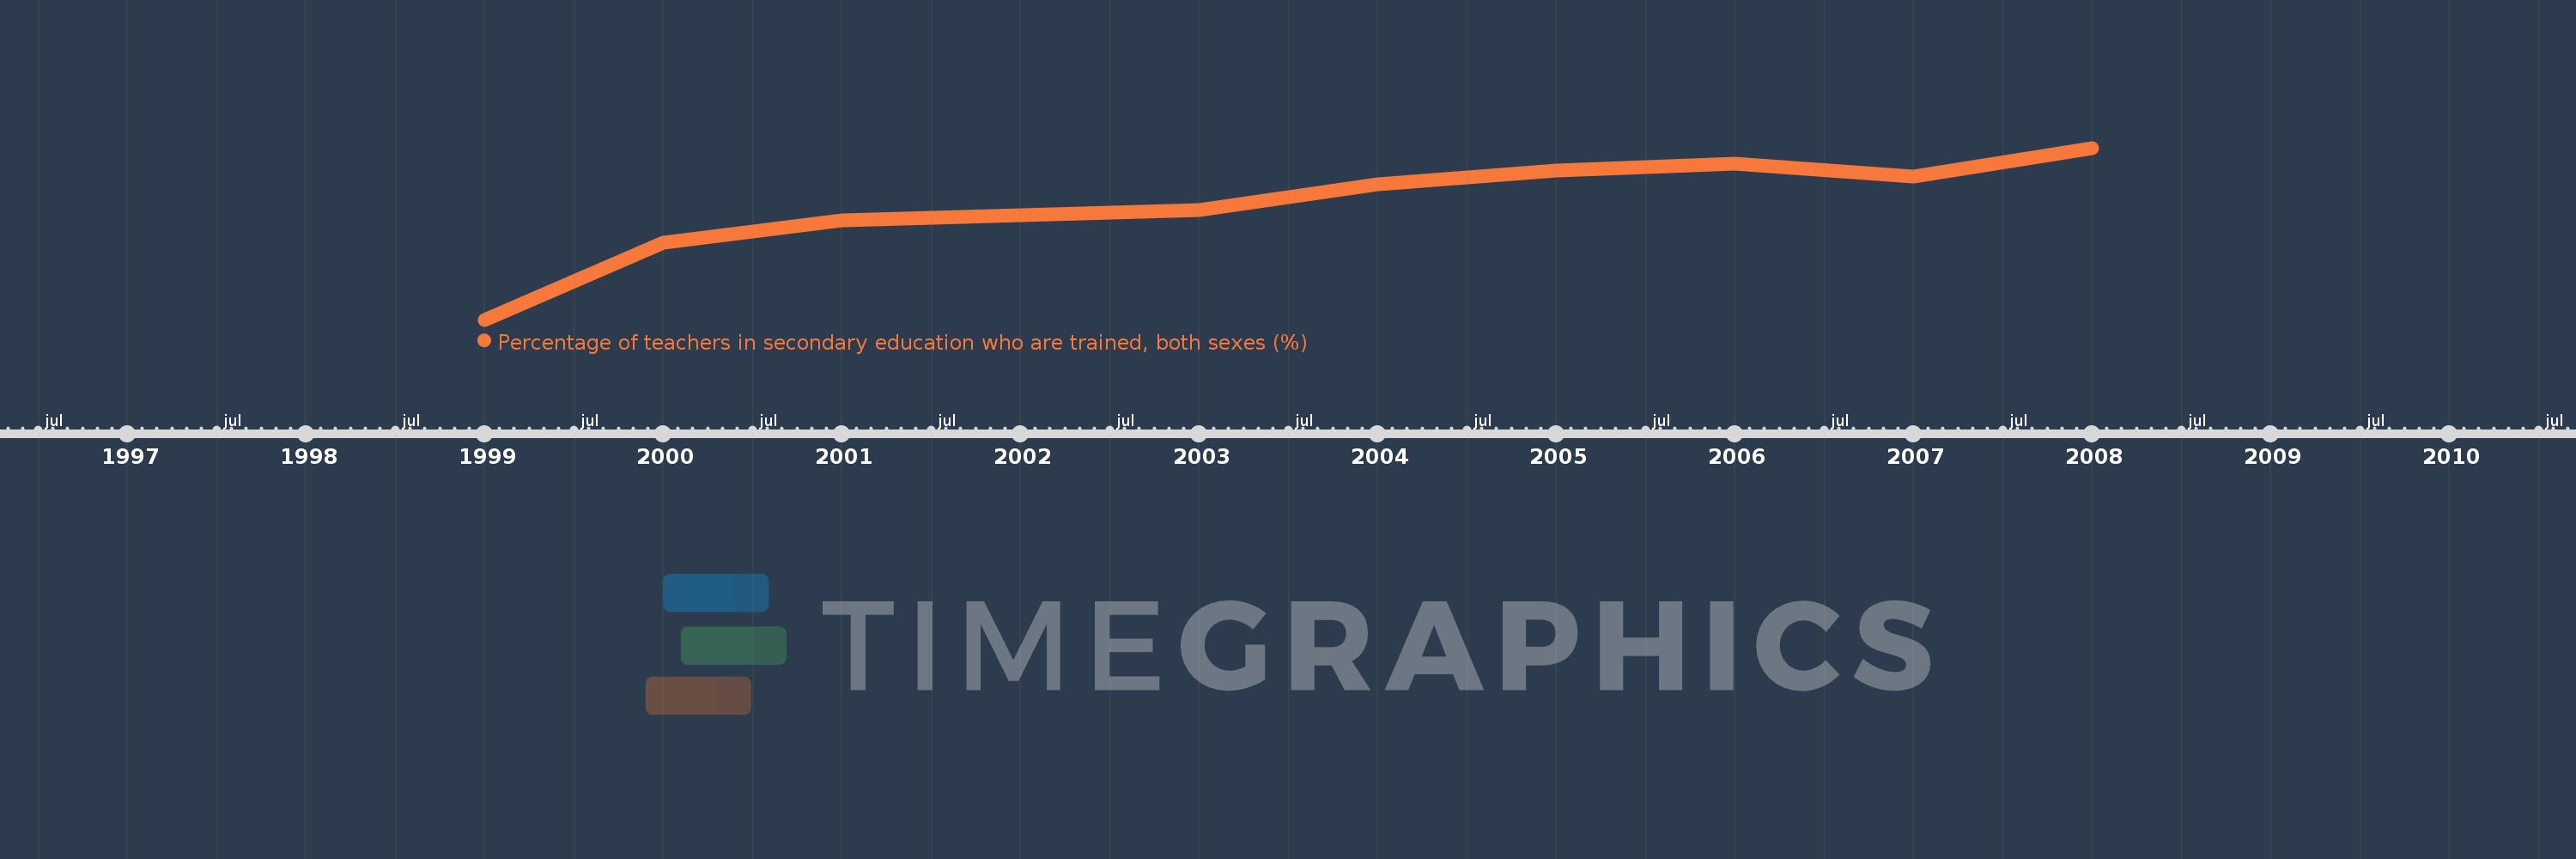
Percentage of teachers in secondary education who are trained, both sexes (%)
2008,2007,2006,2005,2004,2003,2002,2001,2000,1999
This statistics in other country:
Timeline:
This timeline shows a graph from 1999 to 2008 of Namibia. No data until 1998. Number of actual observations by date: 10.
Source name:
World Development Indicators
Source organization:
UNESCO Institute for Statistics
Categories, topics:
Education
Last updated:
apr 23, 2017
Indicators value changes by year
Minimum:
87.713
jan 1, 1999
Maximum:
97.462
jan 1, 2008
At the date of observation
Value
Absolute change
Change from previous value
jan 1, 1999
87.713
+87.713
0.0%
jan 1, 2000
92.093
+4.381
4.99%
jan 1, 2001
93.339
+1.245
1.35%
jan 1, 2002
93.629
+0.291
0.31%
jan 1, 2003
93.96
+0.33
0.35%
jan 1, 2004
95.422
+1.462
1.56%
jan 1, 2005
96.19
+0.768
0.8%
jan 1, 2006
96.557
+0.367
0.38%
jan 1, 2007
95.817
-0.74
-0.77%
jan 1, 2008
97.462
+1.646
1.72%
Ranking of countries by current statistics by years


Comments: