29
/
en
AIzaSyAYiBZKx7MnpbEhh9jyipgxe19OcubqV5w
April 1, 2024
90256
Botswana
BWA
true
2
1
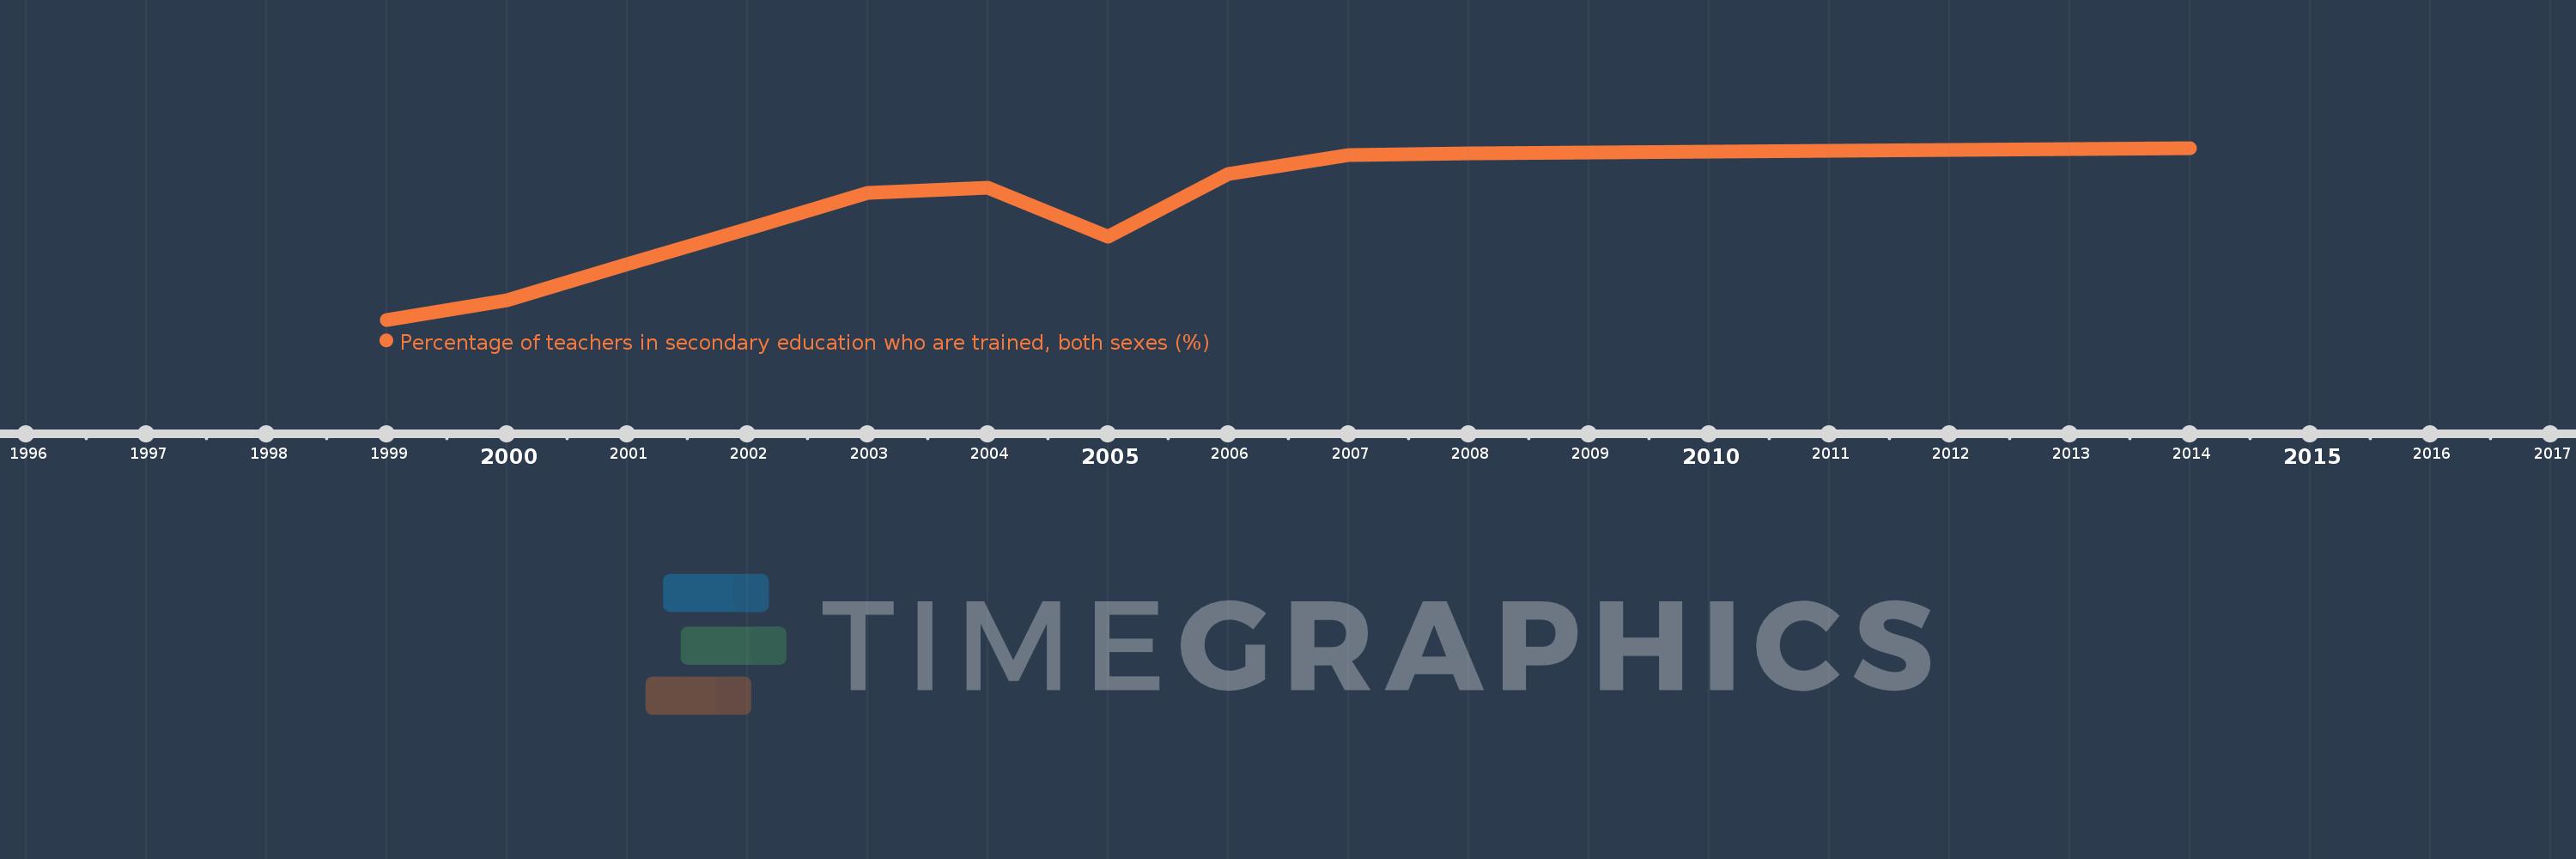
Percentage of teachers in secondary education who are trained, both sexes (%)
2014,2008,2007,2006,2005,2004,2003,2002,2001,2000,1999
This statistics in other country:
Timeline:
This timeline shows a graph from 1999 to 2014 of Botswana. No data until 1998. Number of actual observations by date: 11.
Source name:
World Development Indicators
Source organization:
UNESCO Institute for Statistics
Categories, topics:
Education
Last updated:
apr 23, 2017
Indicators value changes by year
Minimum:
81.764
jan 1, 1999
Maximum:
99.655
jan 1, 2014
At the date of observation
Value
Absolute change
Change from previous value
jan 1, 1999
81.764
+81.764
0.0%
jan 1, 2000
83.796
+2.032
2.49%
jan 1, 2001
87.523
+3.727
4.45%
jan 1, 2002
91.239
+3.716
4.25%
jan 1, 2003
94.964
+3.725
4.08%
jan 1, 2004
95.557
+0.593
0.62%
jan 1, 2005
90.373
-5.184
-5.43%
jan 1, 2006
96.958
+6.586
7.29%
jan 1, 2007
98.909
+1.951
2.01%
jan 1, 2008
99.124
+0.215
0.22%
jan 1, 2014
99.655
+0.531
0.54%
Ranking of countries by current statistics by years


Comments: