29
/
en
AIzaSyAYiBZKx7MnpbEhh9jyipgxe19OcubqV5w
April 1, 2024
79839
Barbados
BRB
true
2
1
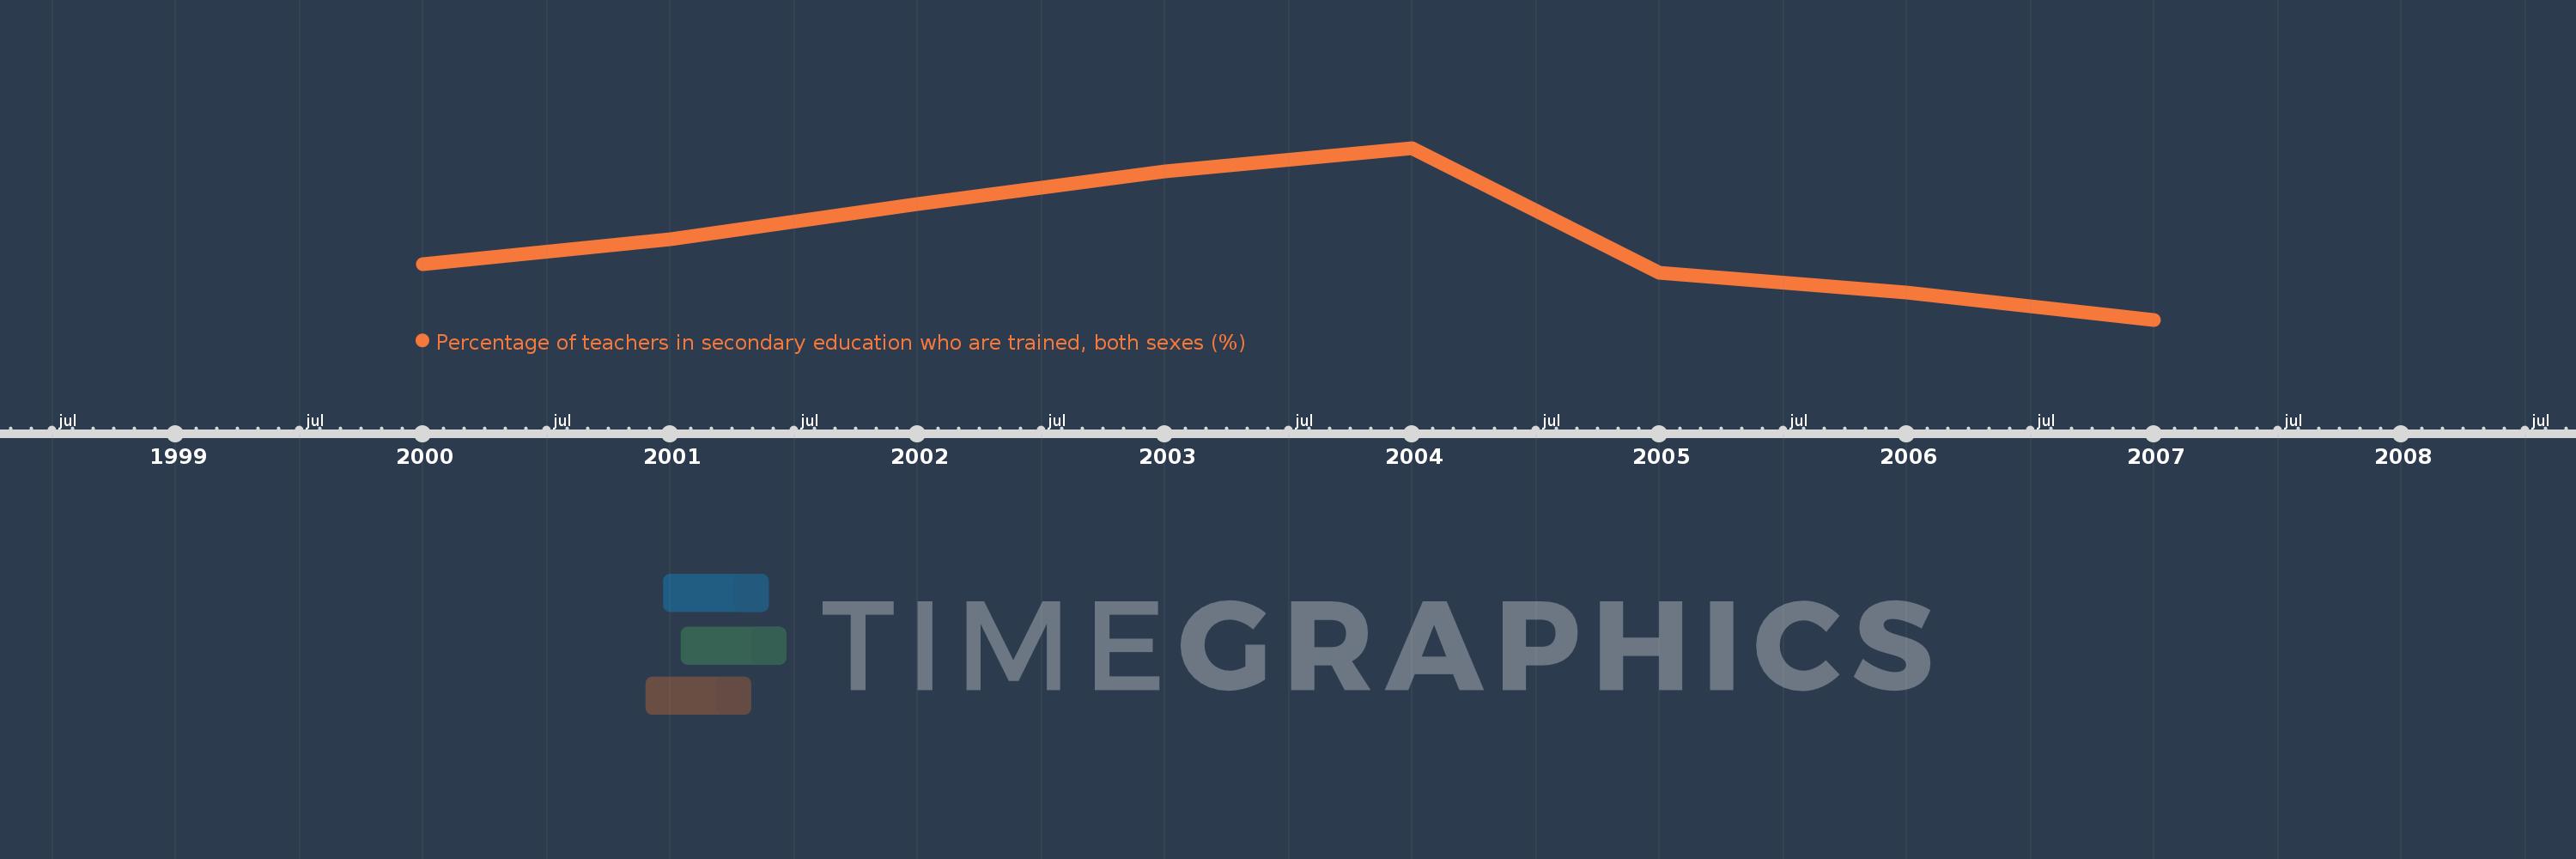
Percentage of teachers in secondary education who are trained, both sexes (%)
2007,2006,2005,2004,2003,2002,2001,2000
This statistics in other country:
Timeline:
This timeline shows a graph from 2000 to 2007 of Barbados. No data until 1999. Number of actual observations by date: 8.
Source name:
World Development Indicators
Source organization:
UNESCO Institute for Statistics
Categories, topics:
Education
Last updated:
apr 23, 2017
Indicators value changes by year
Minimum:
57.133
jan 1, 2007
Maximum:
77.842
jan 1, 2004
At the date of observation
Value
Absolute change
Change from previous value
jan 1, 2000
63.821
+63.821
0.0%
jan 1, 2001
66.831
+3.01
4.72%
jan 1, 2002
71.074
+4.243
6.35%
jan 1, 2003
75.038
+3.963
5.58%
jan 1, 2004
77.842
+2.804
3.74%
jan 1, 2005
62.816
-15.026
-19.3%
jan 1, 2006
60.46
-2.357
-3.75%
jan 1, 2007
57.133
-3.327
-5.5%
Ranking of countries by current statistics by years


Comments: