29
/
en
AIzaSyAYiBZKx7MnpbEhh9jyipgxe19OcubqV5w
April 1, 2024
40232
IDA total
IDA
false
2
1
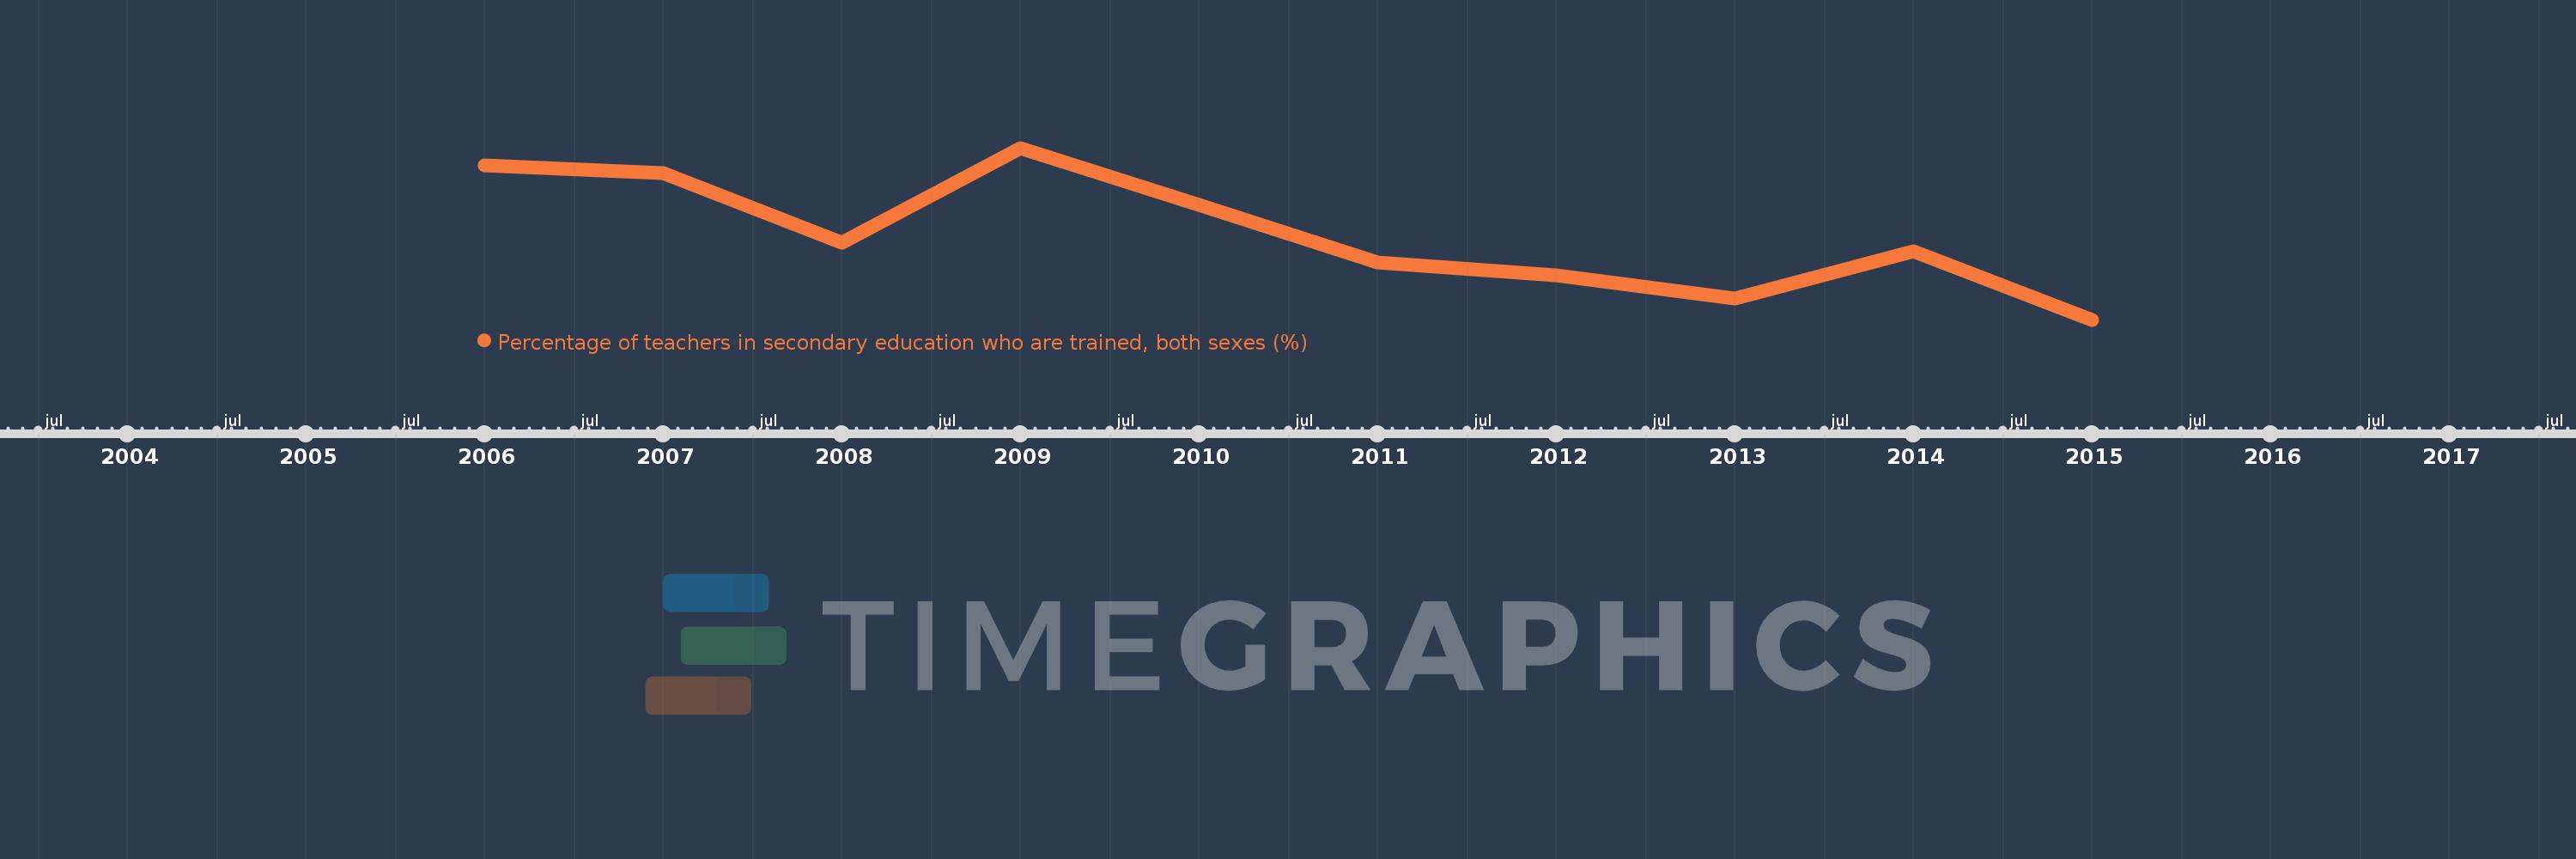
Percentage of teachers in secondary education who are trained, both sexes (%)
2015,2014,2013,2012,2011,2010,2009,2008,2007,2006
This statistics in other country:
Timeline:
This timeline shows a graph from 2006 to 2015 of IDA total. No data until 2005. Number of actual observations by date: 10.
Source name:
World Development Indicators
Source organization:
UNESCO Institute for Statistics
Categories, topics:
Education
Last updated:
apr 23, 2017
Indicators value changes by year
Minimum:
66.705
jan 1, 2015
Maximum:
74.576
jan 1, 2009
At the date of observation
Value
Absolute change
Change from previous value
jan 1, 2006
73.792
+73.792
0.0%
jan 1, 2007
73.42
-0.372
-0.5%
jan 1, 2008
70.237
-3.183
-4.34%
jan 1, 2009
74.576
+4.339
6.18%
jan 1, 2010
71.968
-2.608
-3.5%
jan 1, 2011
69.324
-2.644
-3.67%
jan 1, 2012
68.756
-0.568
-0.82%
jan 1, 2013
67.686
-1.07
-1.56%
jan 1, 2014
69.85
+2.163
3.2%
jan 1, 2015
66.705
-3.145
-4.5%
Ranking of countries by current statistics by years


Comments: