29
/
en
AIzaSyAYiBZKx7MnpbEhh9jyipgxe19OcubqV5w
April 1, 2024
107741
Colombia
COL
true
2
1
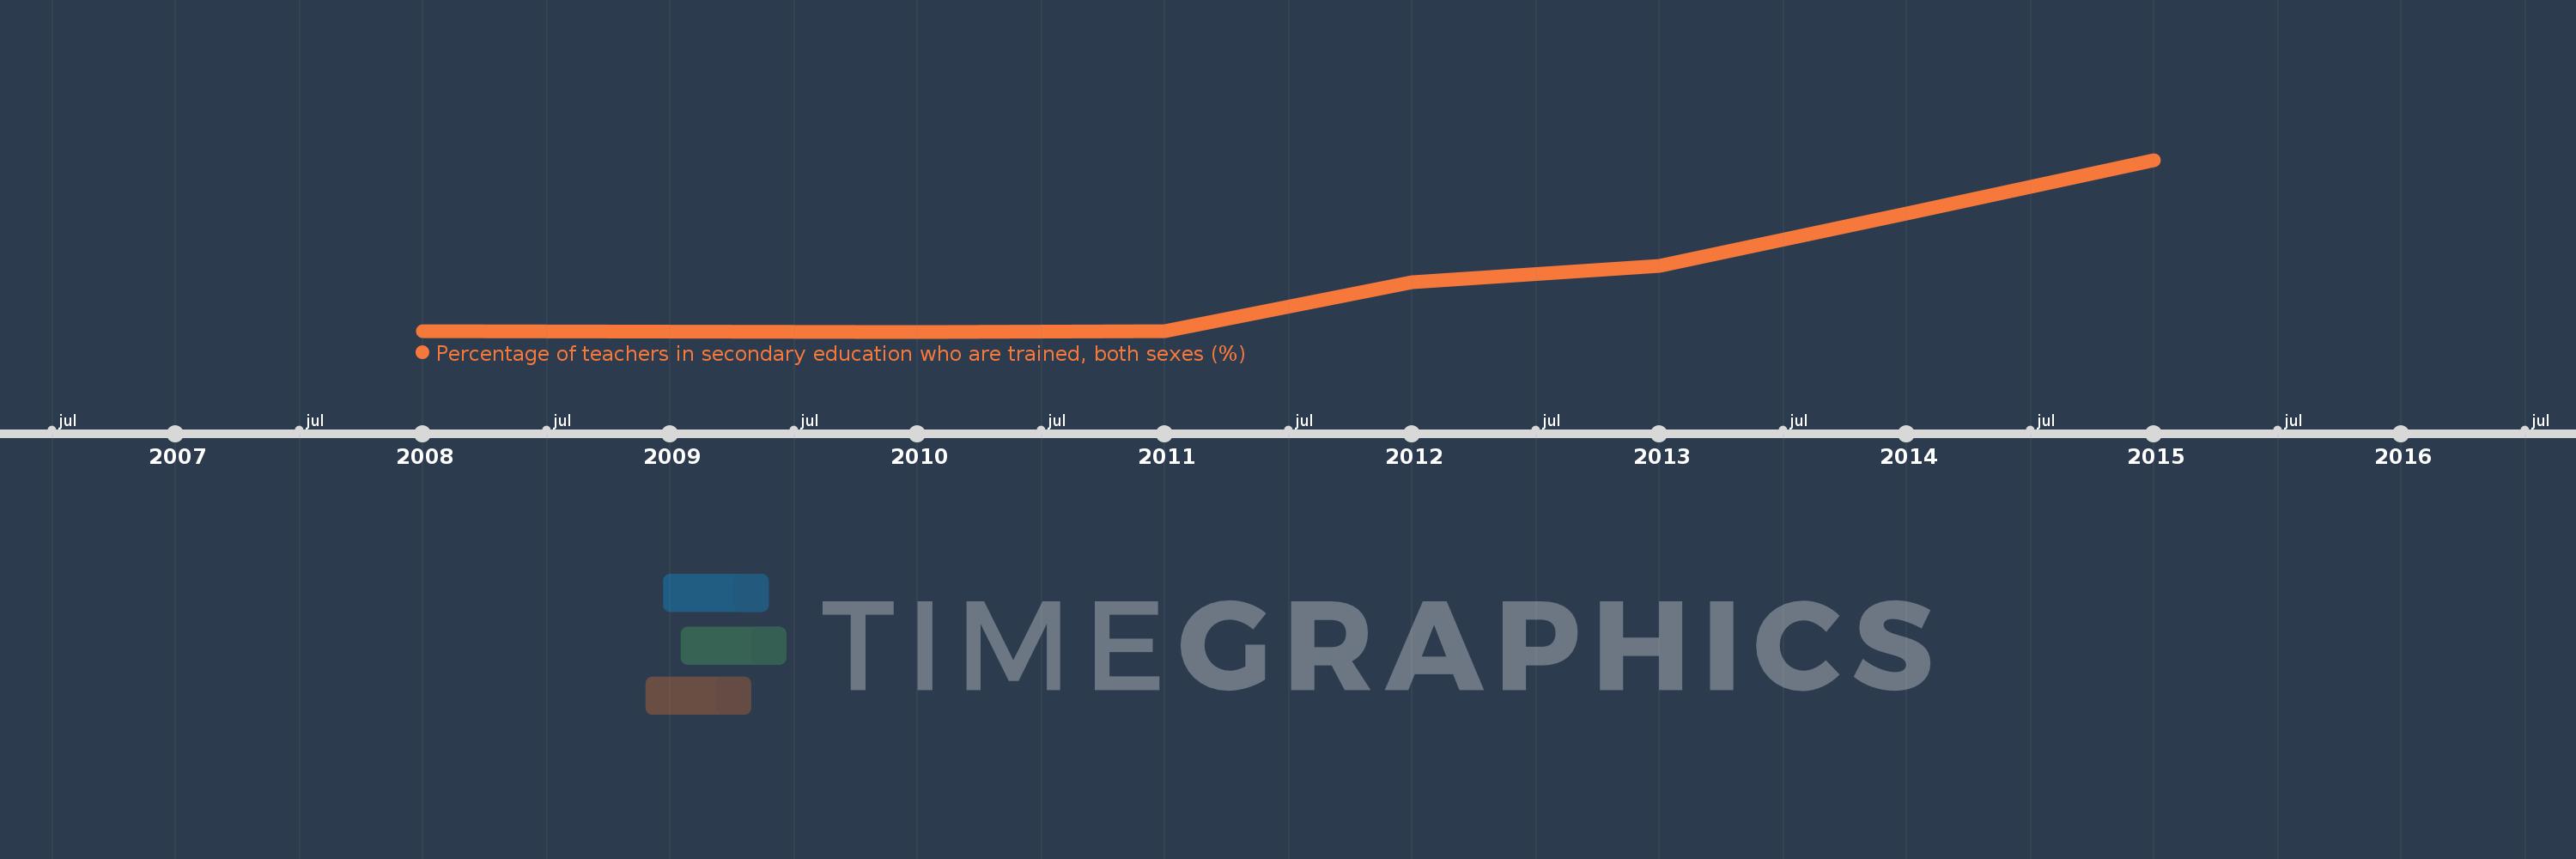
Percentage of teachers in secondary education who are trained, both sexes (%)
2015,2014,2013,2012,2011,2010,2008
This statistics in other country:
Timeline:
This timeline shows a graph from 2008 to 2015 of Colombia. No data until 2007. Number of actual observations by date: 7.
Source name:
World Development Indicators
Source organization:
UNESCO Institute for Statistics
Categories, topics:
Education
Last updated:
apr 23, 2017
Indicators value changes by year
Minimum:
96.437
jan 1, 2010
Maximum:
99.067
jan 1, 2015
At the date of observation
Value
Absolute change
Change from previous value
jan 1, 2008
96.447
+96.447
0.0%
jan 1, 2010
96.437
-0.01
-0.01%
jan 1, 2011
96.45
+0.013
0.01%
jan 1, 2012
97.19
+0.741
0.77%
jan 1, 2013
97.443
+0.253
0.26%
jan 1, 2014
98.251
+0.808
0.83%
jan 1, 2015
99.067
+0.815
0.83%
Ranking of countries by current statistics by years


Comments: