29
/
en
AIzaSyAYiBZKx7MnpbEhh9jyipgxe19OcubqV5w
April 1, 2024
252286
St. Vincent and the Grenadines
VCT
true
2
1
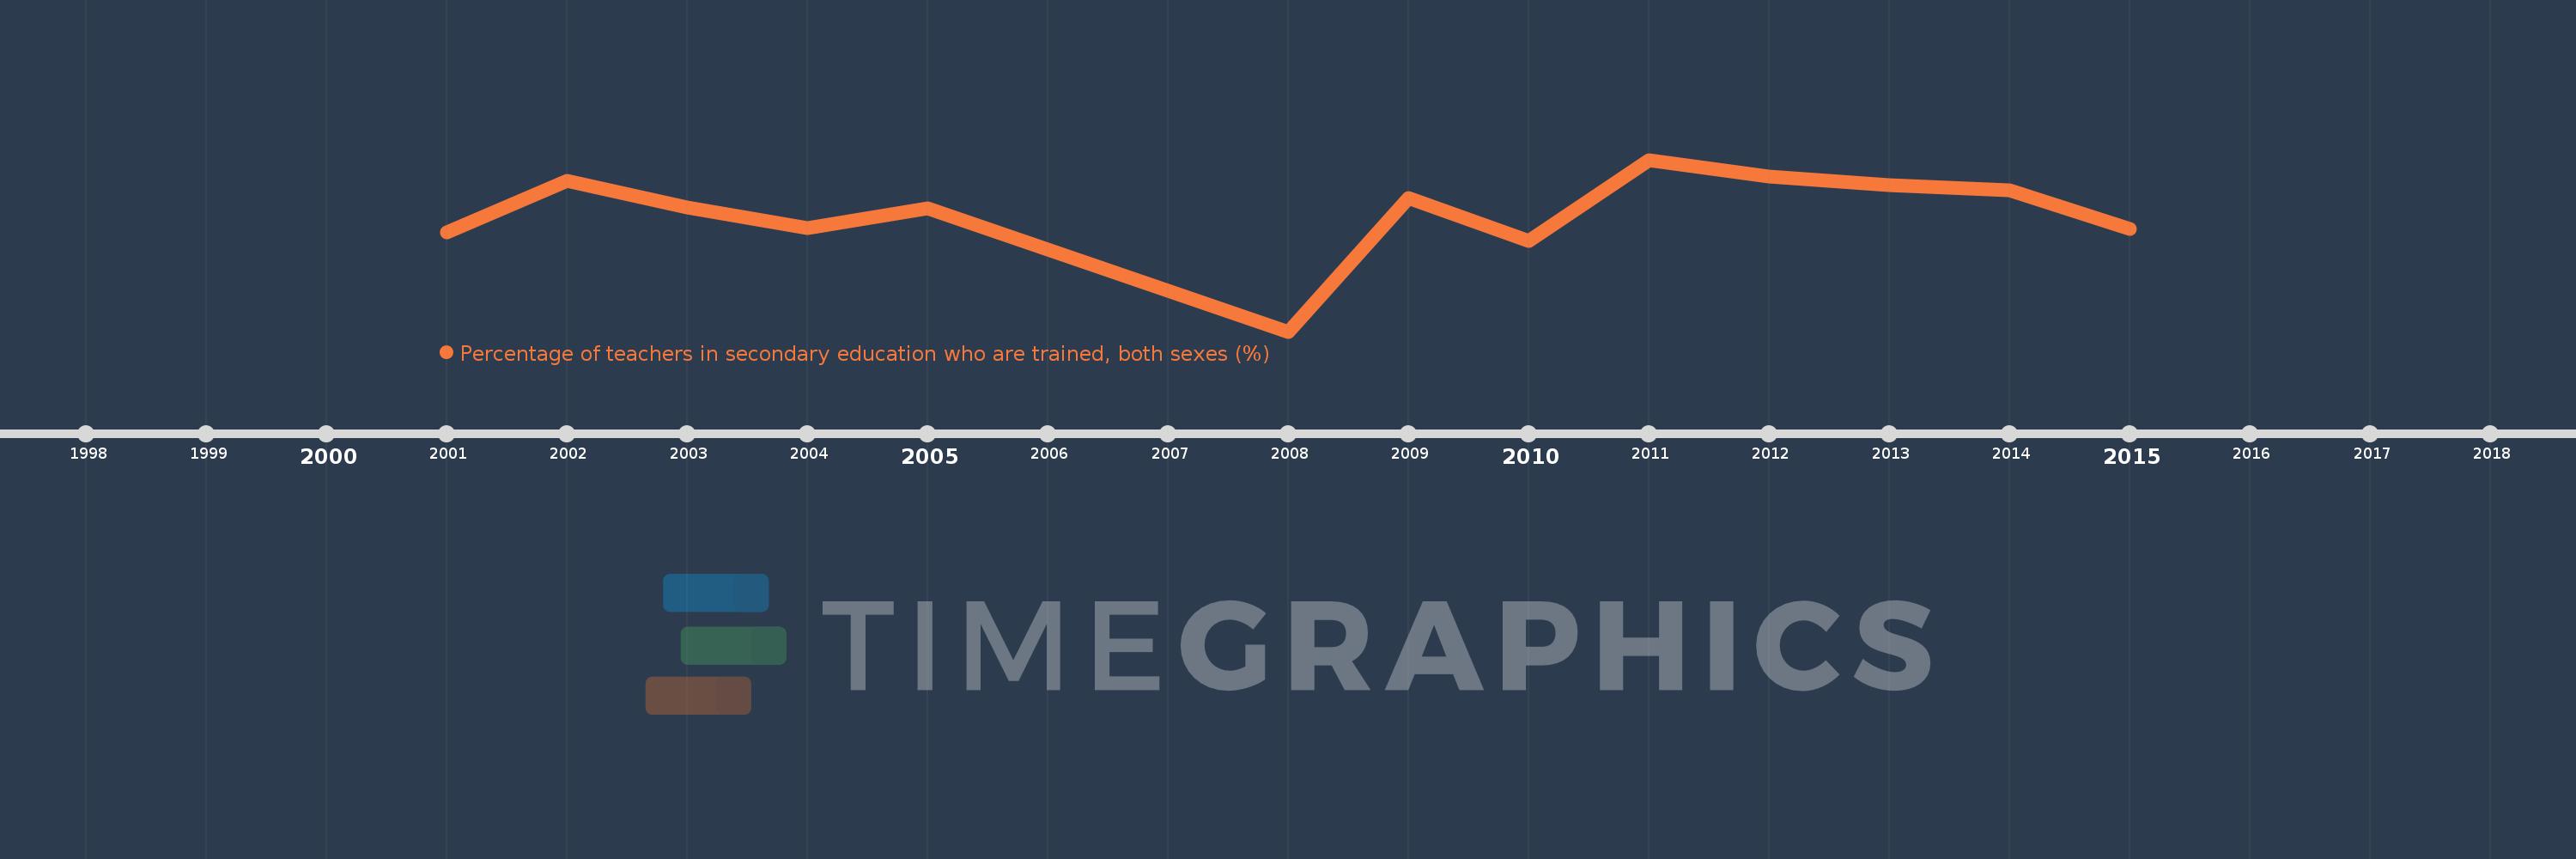
Percentage of teachers in secondary education who are trained, both sexes (%)
2015,2014,2013,2012,2011,2010,2009,2008,2005,2004,2003,2002,2001
This statistics in other country:
Timeline:
This timeline shows a graph from 2001 to 2015 of St. Vincent and the Grenadines. No data until 2000. Number of actual observations by date: 13.
Source name:
World Development Indicators
Source organization:
UNESCO Institute for Statistics
Categories, topics:
Education
Last updated:
apr 23, 2017
Indicators value changes by year
Minimum:
31.107
jan 1, 2008
Maximum:
62.941
jan 1, 2011
At the date of observation
Value
Absolute change
Change from previous value
jan 1, 2001
49.507
+49.507
0.0%
jan 1, 2002
59.012
+9.505
19.2%
jan 1, 2003
54.157
-4.856
-8.23%
jan 1, 2004
50.343
-3.814
-7.04%
jan 1, 2005
53.913
+3.57
7.09%
jan 1, 2008
31.107
-22.806
-42.3%
jan 1, 2009
55.853
+24.746
79.55%
jan 1, 2010
47.968
-7.884
-14.12%
jan 1, 2011
62.941
+14.973
31.21%
jan 1, 2012
59.846
-3.095
-4.92%
jan 1, 2013
58.235
-1.611
-2.69%
jan 1, 2014
57.365
-0.87
-1.49%
jan 1, 2015
50.149
-7.216
-12.58%
Ranking of countries by current statistics by years


Comments: