29
/
en
AIzaSyAYiBZKx7MnpbEhh9jyipgxe19OcubqV5w
April 1, 2024
196033
Mexico
MEX
true
2
1
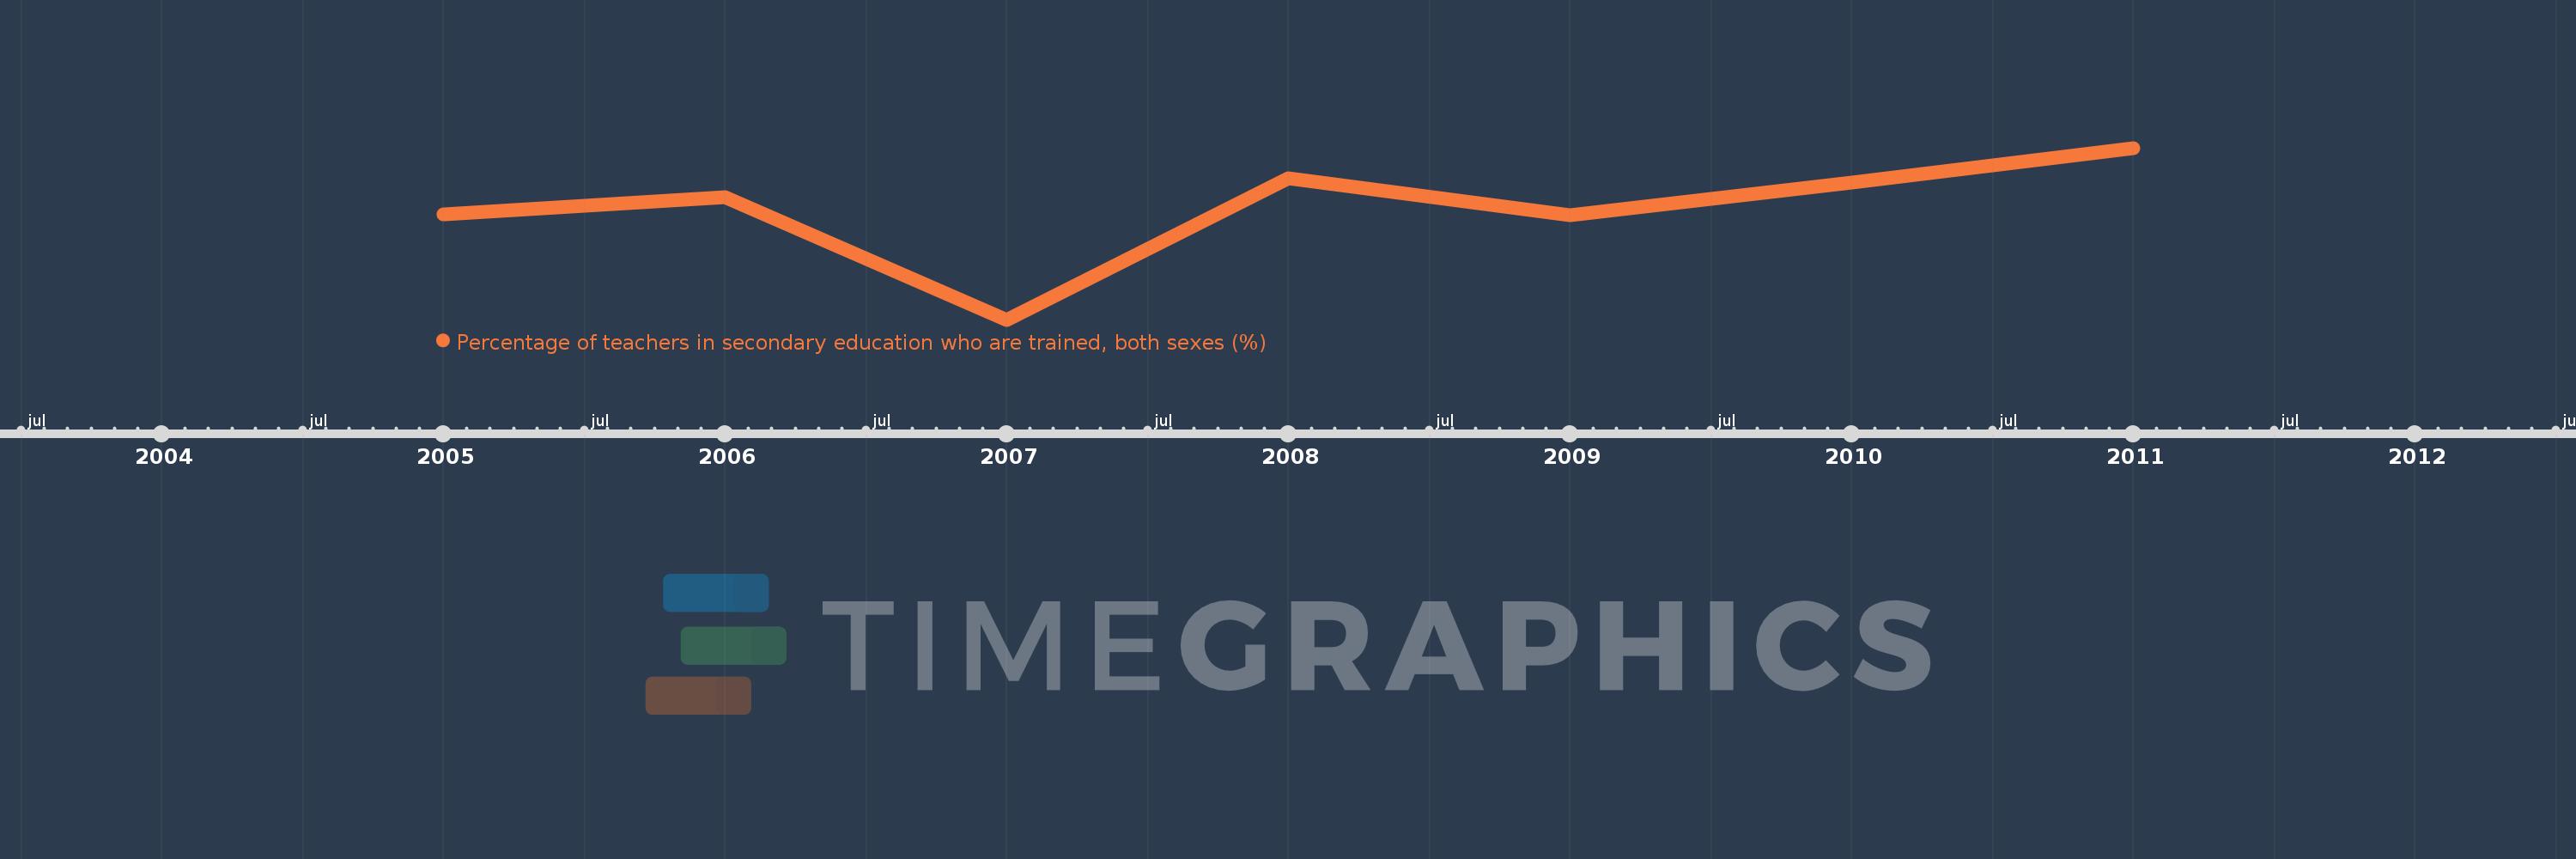
Percentage of teachers in secondary education who are trained, both sexes (%)
2011,2010,2009,2008,2007,2006,2005
This statistics in other country:
Timeline:
This timeline shows a graph from 2005 to 2011 of Mexico. No data until 2004. Number of actual observations by date: 7.
Source name:
World Development Indicators
Source organization:
UNESCO Institute for Statistics
Categories, topics:
Education
Last updated:
apr 23, 2017
Indicators value changes by year
Minimum:
85.318
jan 1, 2007
Maximum:
90.996
jan 1, 2011
At the date of observation
Value
Absolute change
Change from previous value
jan 1, 2005
88.796
+88.796
0.0%
jan 1, 2006
89.367
+0.571
0.64%
jan 1, 2007
85.318
-4.049
-4.53%
jan 1, 2008
90.006
+4.688
5.5%
jan 1, 2009
88.786
-1.22
-1.36%
jan 1, 2010
89.853
+1.067
1.2%
jan 1, 2011
90.996
+1.142
1.27%
Ranking of countries by current statistics by years


Comments: