29
/
en
AIzaSyAYiBZKx7MnpbEhh9jyipgxe19OcubqV5w
April 1, 2024
92209
British Virgin Islands
VGB
true
2
1
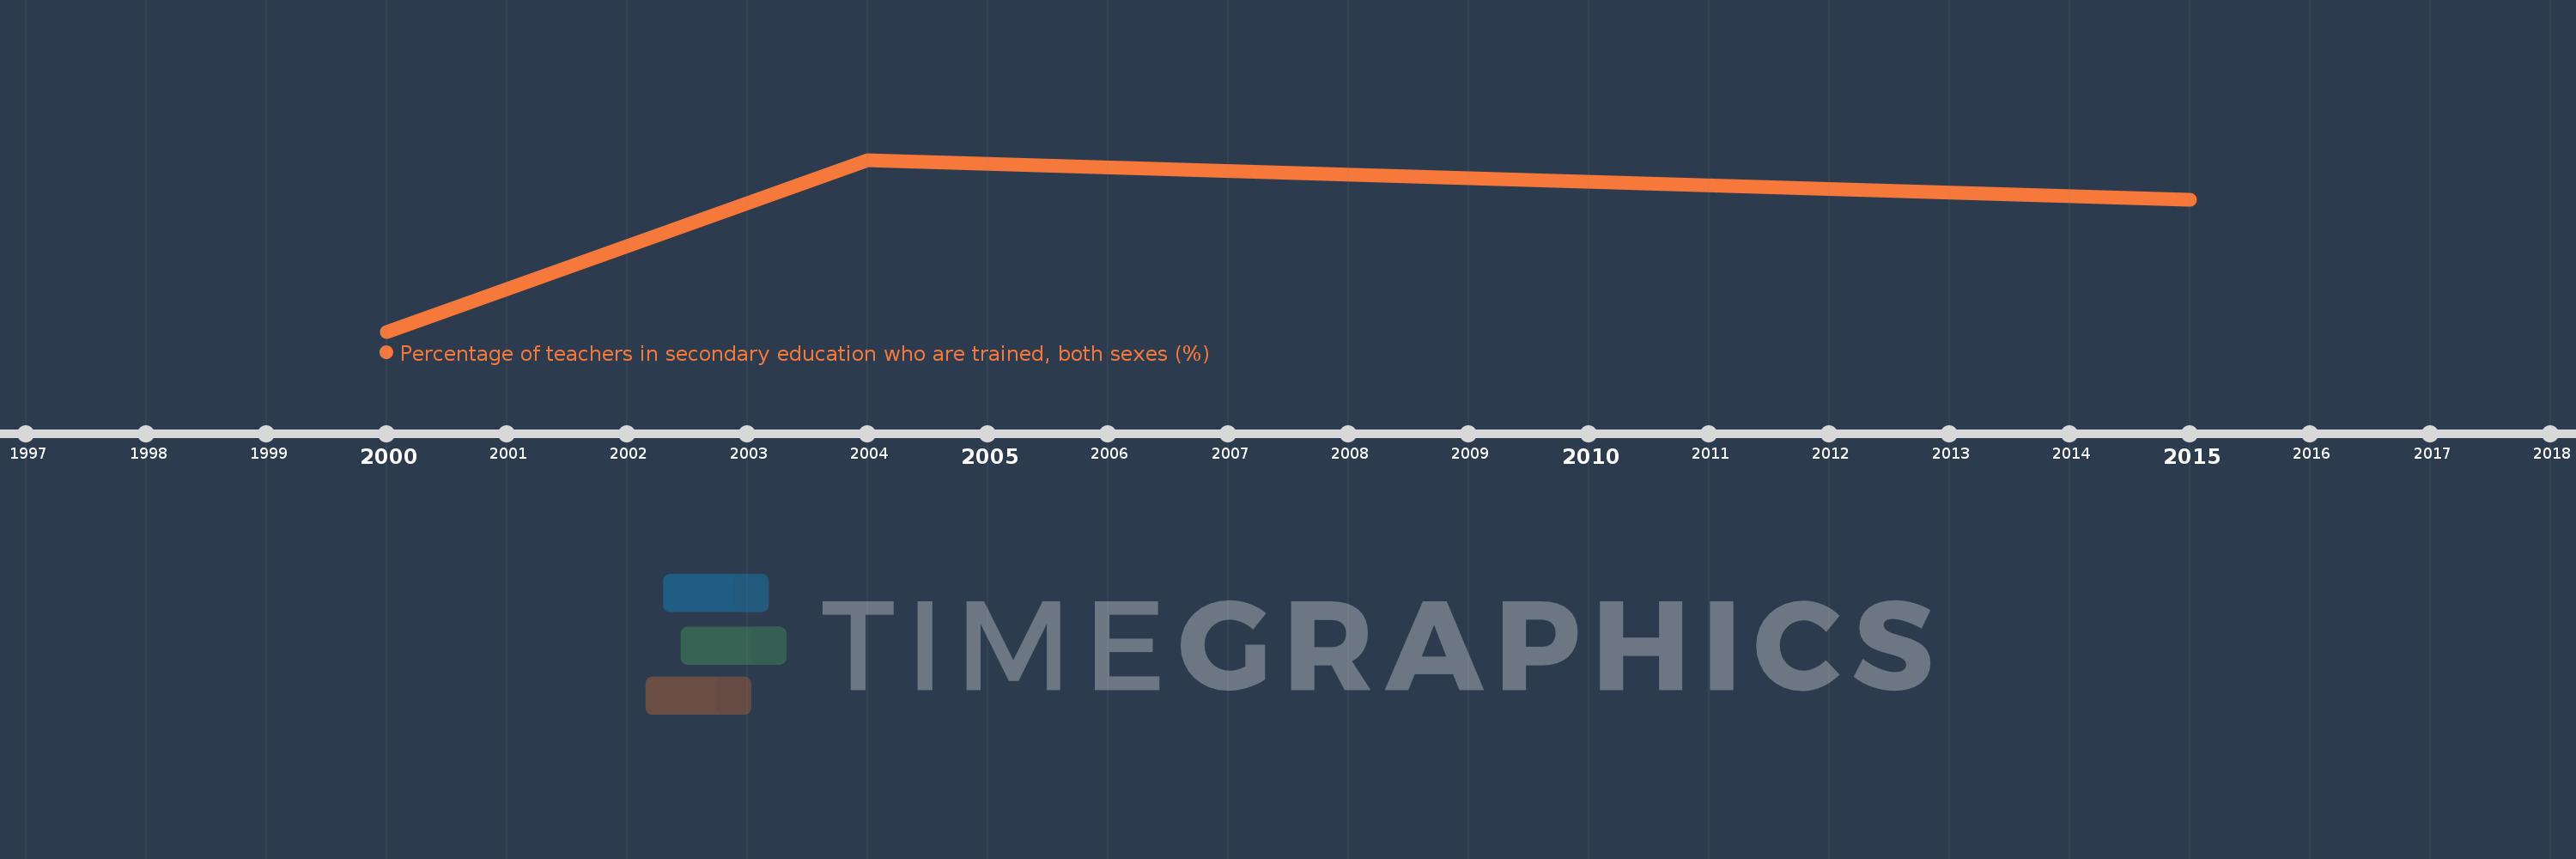
Percentage of teachers in secondary education who are trained, both sexes (%)
2015,2004,2000
This statistics in other country:
Timeline:
This timeline shows a graph from 2000 to 2015 of British Virgin Islands. No data until 1999. Number of actual observations by date: 3.
Source name:
World Development Indicators
Source organization:
UNESCO Institute for Statistics
Categories, topics:
Education
Last updated:
apr 23, 2017
Indicators value changes by year
Minimum:
63.158
jan 1, 2000
Maximum:
71.765
jan 1, 2004
At the date of observation
Value
Absolute change
Change from previous value
jan 1, 2000
63.158
+63.158
0.0%
jan 1, 2004
71.765
+8.607
13.63%
jan 1, 2015
69.767
-1.997
-2.78%
Ranking of countries by current statistics by years


Comments: