29
/
en
AIzaSyAYiBZKx7MnpbEhh9jyipgxe19OcubqV5w
April 1, 2024
69155
Antigua and Barbuda
ATG
true
2
1
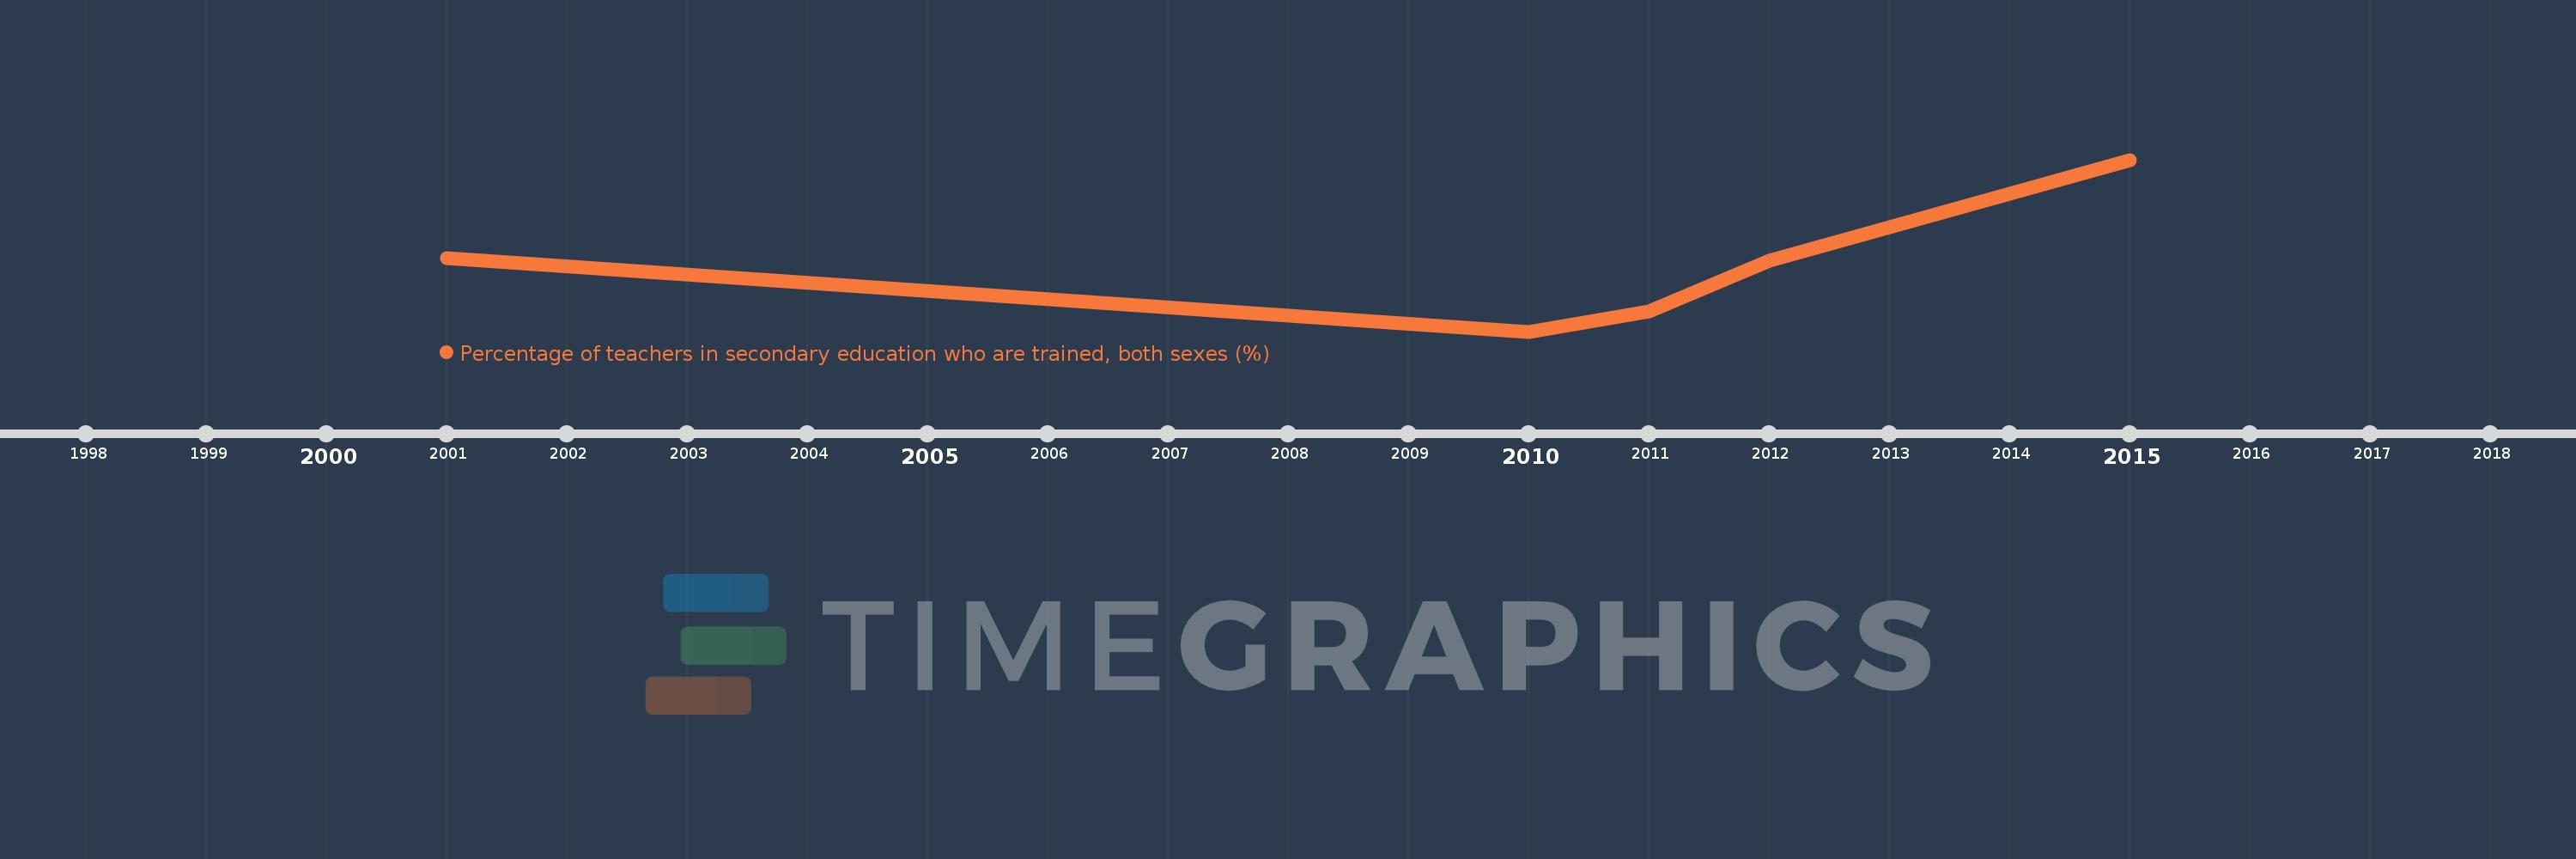
Percentage of teachers in secondary education who are trained, both sexes (%)
2015,2012,2011,2010,2001
This statistics in other country:
Timeline:
This timeline shows a graph from 2001 to 2015 of Antigua and Barbuda. No data until 2000. Number of actual observations by date: 5.
Source name:
World Development Indicators
Source organization:
UNESCO Institute for Statistics
Categories, topics:
Education
Last updated:
apr 23, 2017
Indicators value changes by year
Minimum:
41.298
jan 1, 2010
Maximum:
55.193
jan 1, 2015
At the date of observation
Value
Absolute change
Change from previous value
jan 1, 2001
47.208
+47.208
0.0%
jan 1, 2010
41.298
-5.91
-12.52%
jan 1, 2011
42.939
+1.642
3.97%
jan 1, 2012
47.026
+4.086
9.52%
jan 1, 2015
55.193
+8.167
17.37%
Ranking of countries by current statistics by years


Comments: