29
/
en
AIzaSyAYiBZKx7MnpbEhh9jyipgxe19OcubqV5w
April 1, 2024
183242
Macao SAR, China
MAC
true
2
1
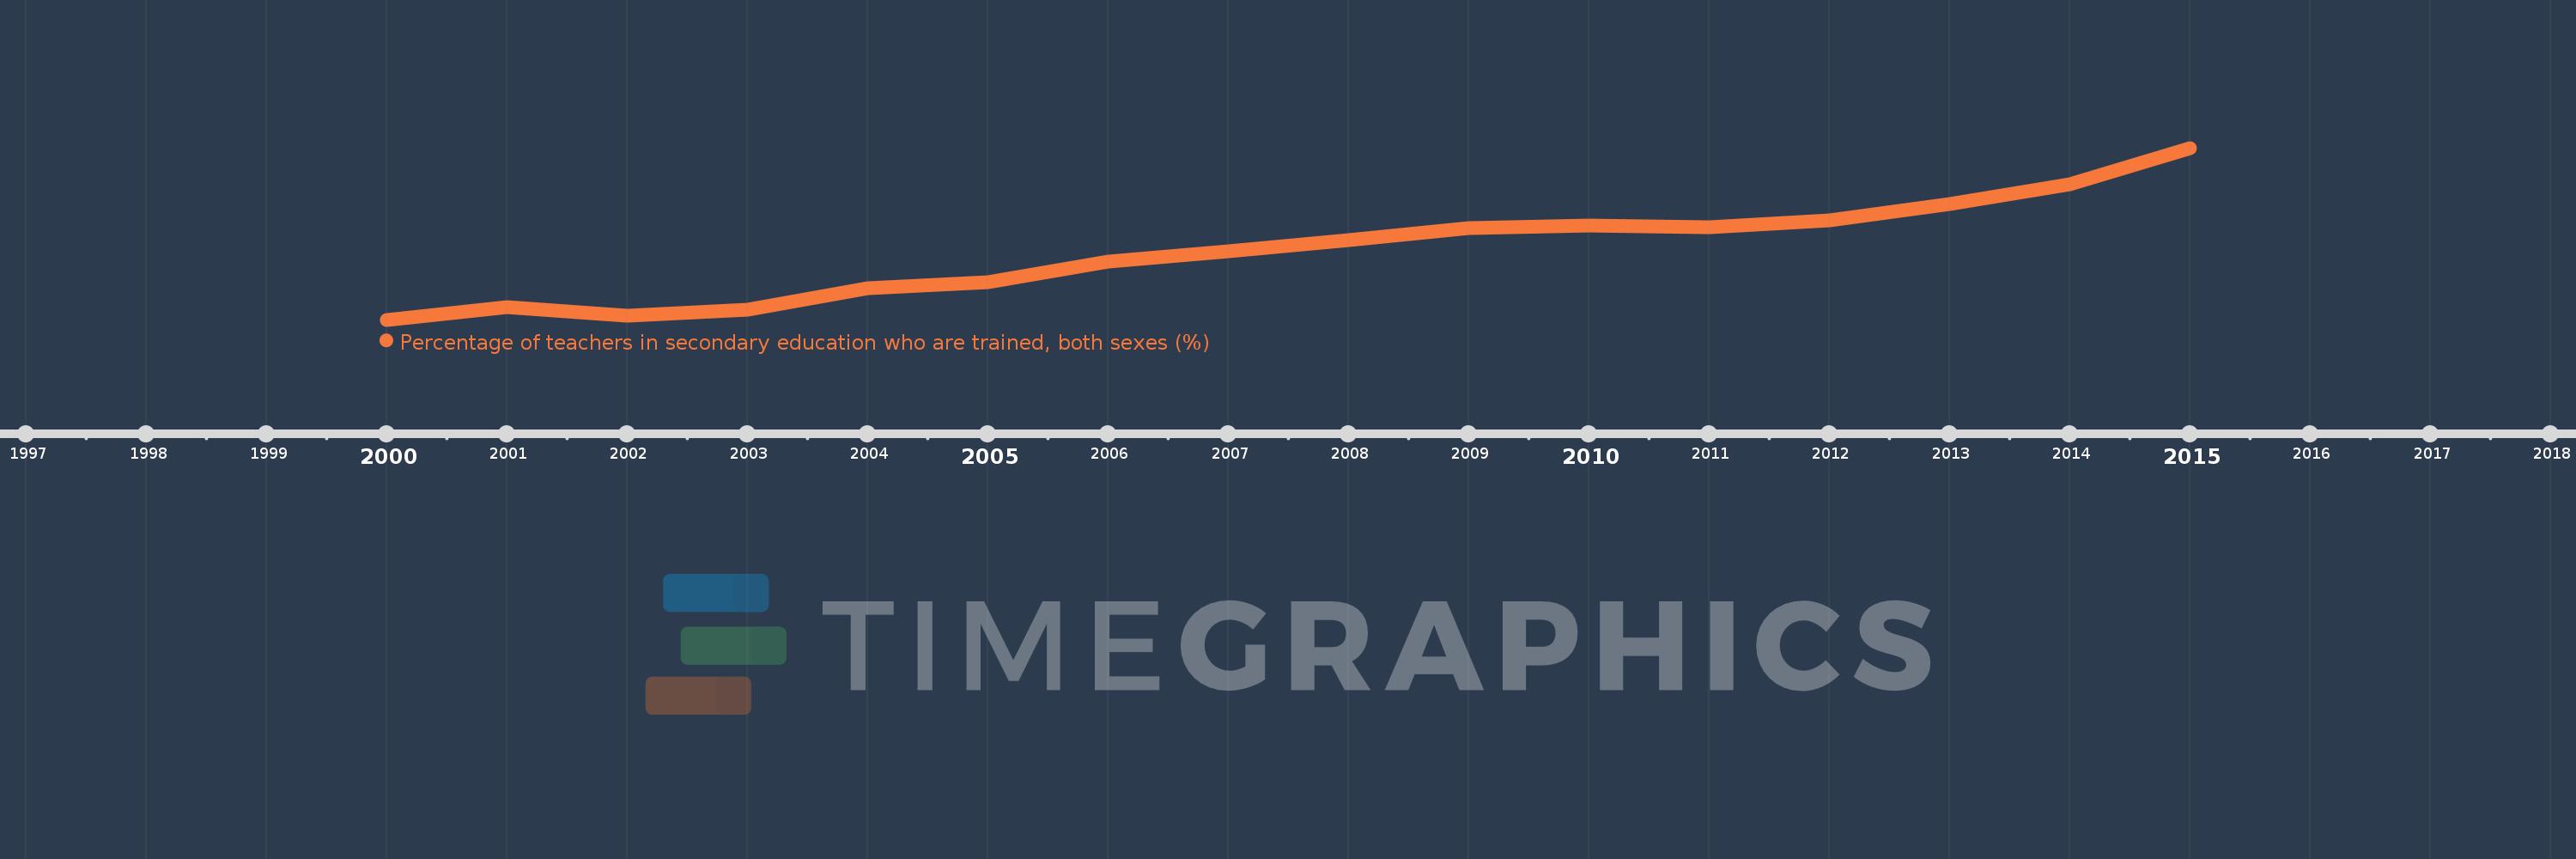
Percentage of teachers in secondary education who are trained, both sexes (%)
2015,2014,2013,2012,2011,2010,2009,2008,2007,2006,2005,2004,2003,2002,2001,2000
This statistics in other country:
Timeline:
This timeline shows a graph from 2000 to 2015 of Macao SAR, China. No data until 1999. Number of actual observations by date: 16.
Source name:
World Development Indicators
Source organization:
UNESCO Institute for Statistics
Categories, topics:
Education
Last updated:
apr 23, 2017
Indicators value changes by year
Minimum:
58.819
jan 1, 2000
Maximum:
81.759
jan 1, 2015
At the date of observation
Value
Absolute change
Change from previous value
jan 1, 2000
58.819
+58.819
0.0%
jan 1, 2001
60.5
+1.68
2.86%
jan 1, 2002
59.346
-1.154
-1.91%
jan 1, 2003
60.125
+0.779
1.31%
jan 1, 2004
62.982
+2.856
4.75%
jan 1, 2005
63.868
+0.886
1.41%
jan 1, 2006
66.586
+2.718
4.26%
jan 1, 2007
67.967
+1.38
2.07%
jan 1, 2008
69.457
+1.49
2.19%
jan 1, 2009
71.015
+1.558
2.24%
jan 1, 2010
71.447
+0.432
0.61%
jan 1, 2011
71.168
-0.28
-0.39%
jan 1, 2012
72.097
+0.929
1.31%
jan 1, 2013
74.274
+2.177
3.02%
jan 1, 2014
76.923
+2.649
3.57%
jan 1, 2015
81.759
+4.836
6.29%
Ranking of countries by current statistics by years


Comments: