29
/
en
AIzaSyAYiBZKx7MnpbEhh9jyipgxe19OcubqV5w
April 1, 2024
123963
Ecuador
ECU
true
2
1
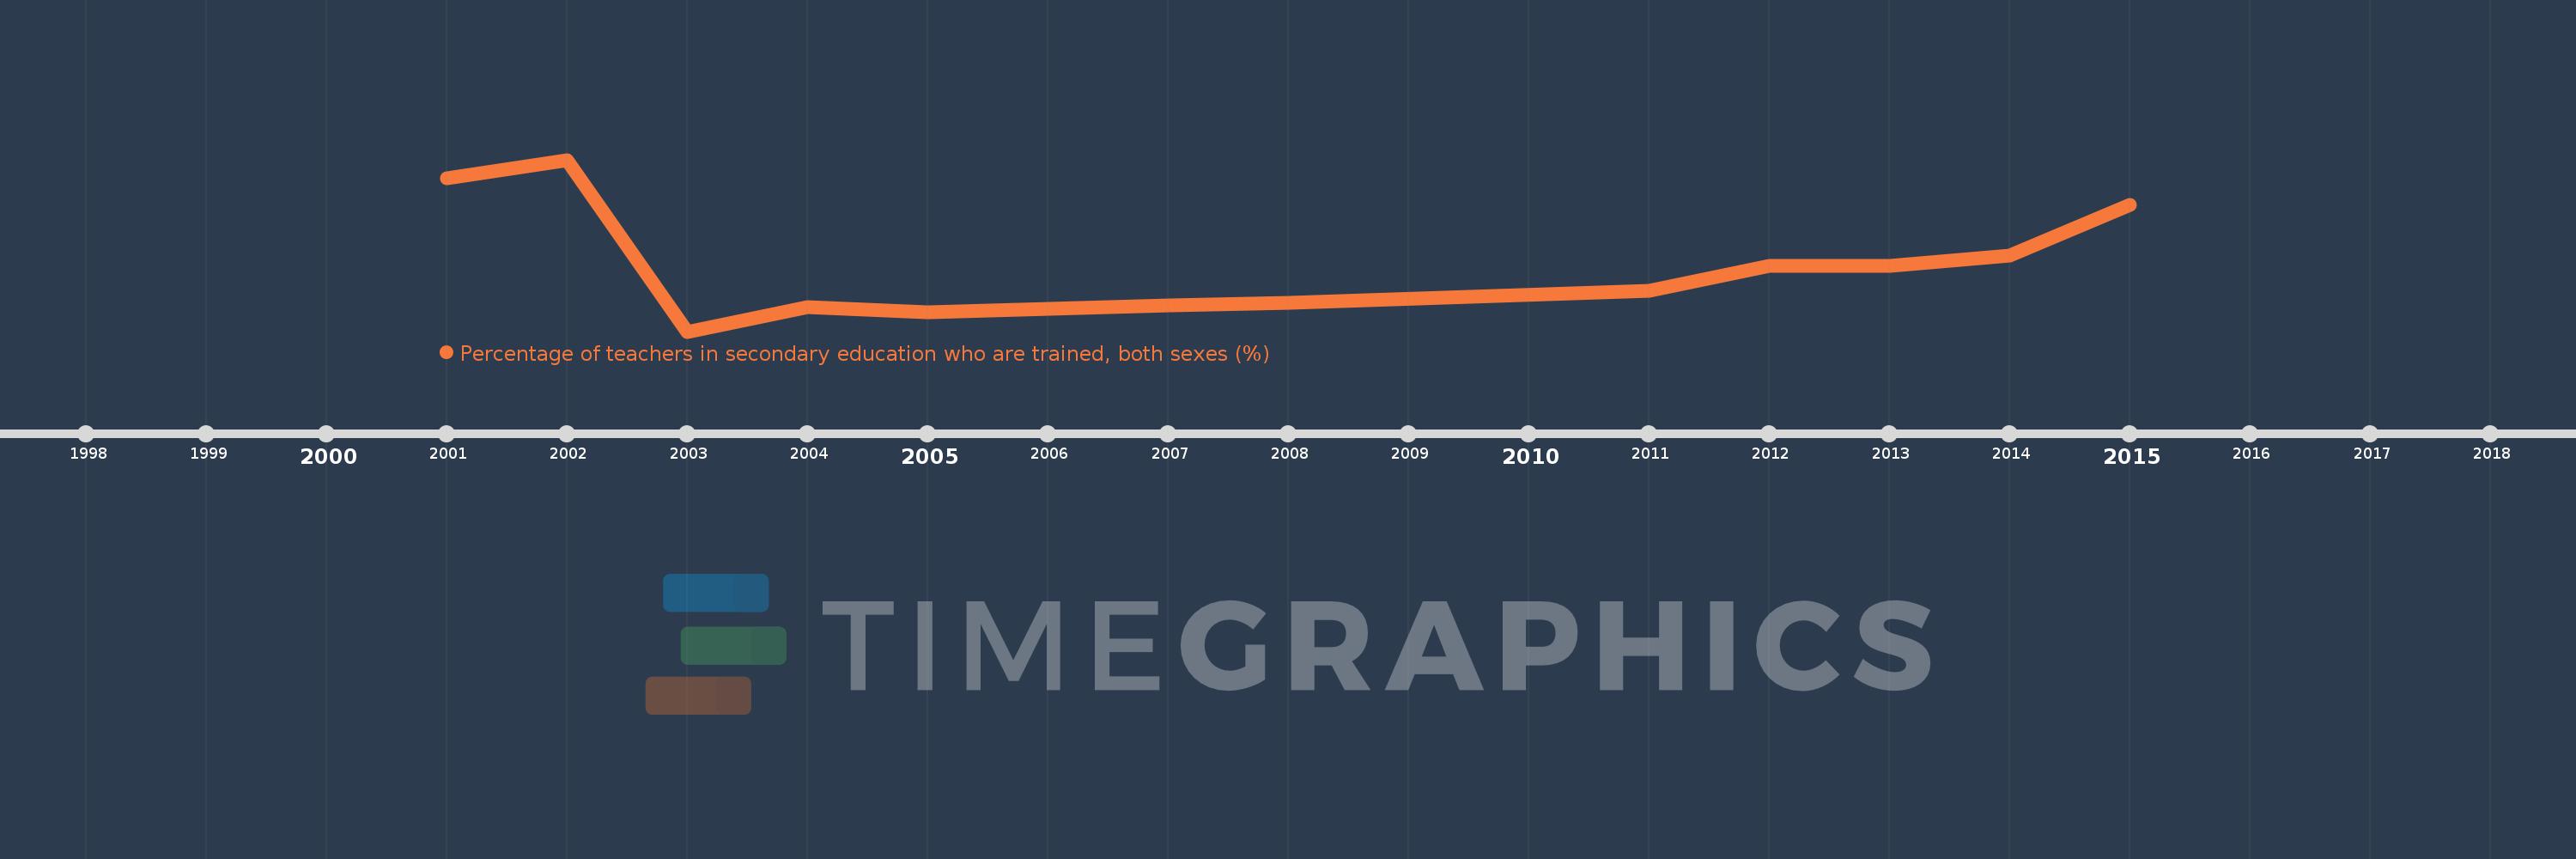
Percentage of teachers in secondary education who are trained, both sexes (%)
2015,2014,2013,2012,2011,2008,2007,2006,2005,2004,2003,2002,2001
This statistics in other country:
Timeline:
This timeline shows a graph from 2001 to 2015 of Ecuador. No data until 2000. Number of actual observations by date: 13.
Source name:
World Development Indicators
Source organization:
UNESCO Institute for Statistics
Categories, topics:
Education
Last updated:
apr 23, 2017
Indicators value changes by year
Minimum:
67.369
jan 1, 2003
Maximum:
86.301
jan 1, 2002
At the date of observation
Value
Absolute change
Change from previous value
jan 1, 2001
84.245
+84.245
0.0%
jan 1, 2002
86.301
+2.056
2.44%
jan 1, 2003
67.369
-18.932
-21.94%
jan 1, 2004
70.077
+2.708
4.02%
jan 1, 2005
69.47
-0.606
-0.87%
jan 1, 2006
69.859
+0.388
0.56%
jan 1, 2007
70.244
+0.385
0.55%
jan 1, 2008
70.523
+0.279
0.4%
jan 1, 2011
71.847
+1.325
1.88%
jan 1, 2012
74.568
+2.72
3.79%
jan 1, 2013
74.598
+0.03
0.04%
jan 1, 2014
75.736
+1.138
1.53%
jan 1, 2015
81.291
+5.555
7.33%
Ranking of countries by current statistics by years


Comments: