29
/
en
AIzaSyAYiBZKx7MnpbEhh9jyipgxe19OcubqV5w
April 1, 2024
204513
Myanmar
MMR
true
2
1
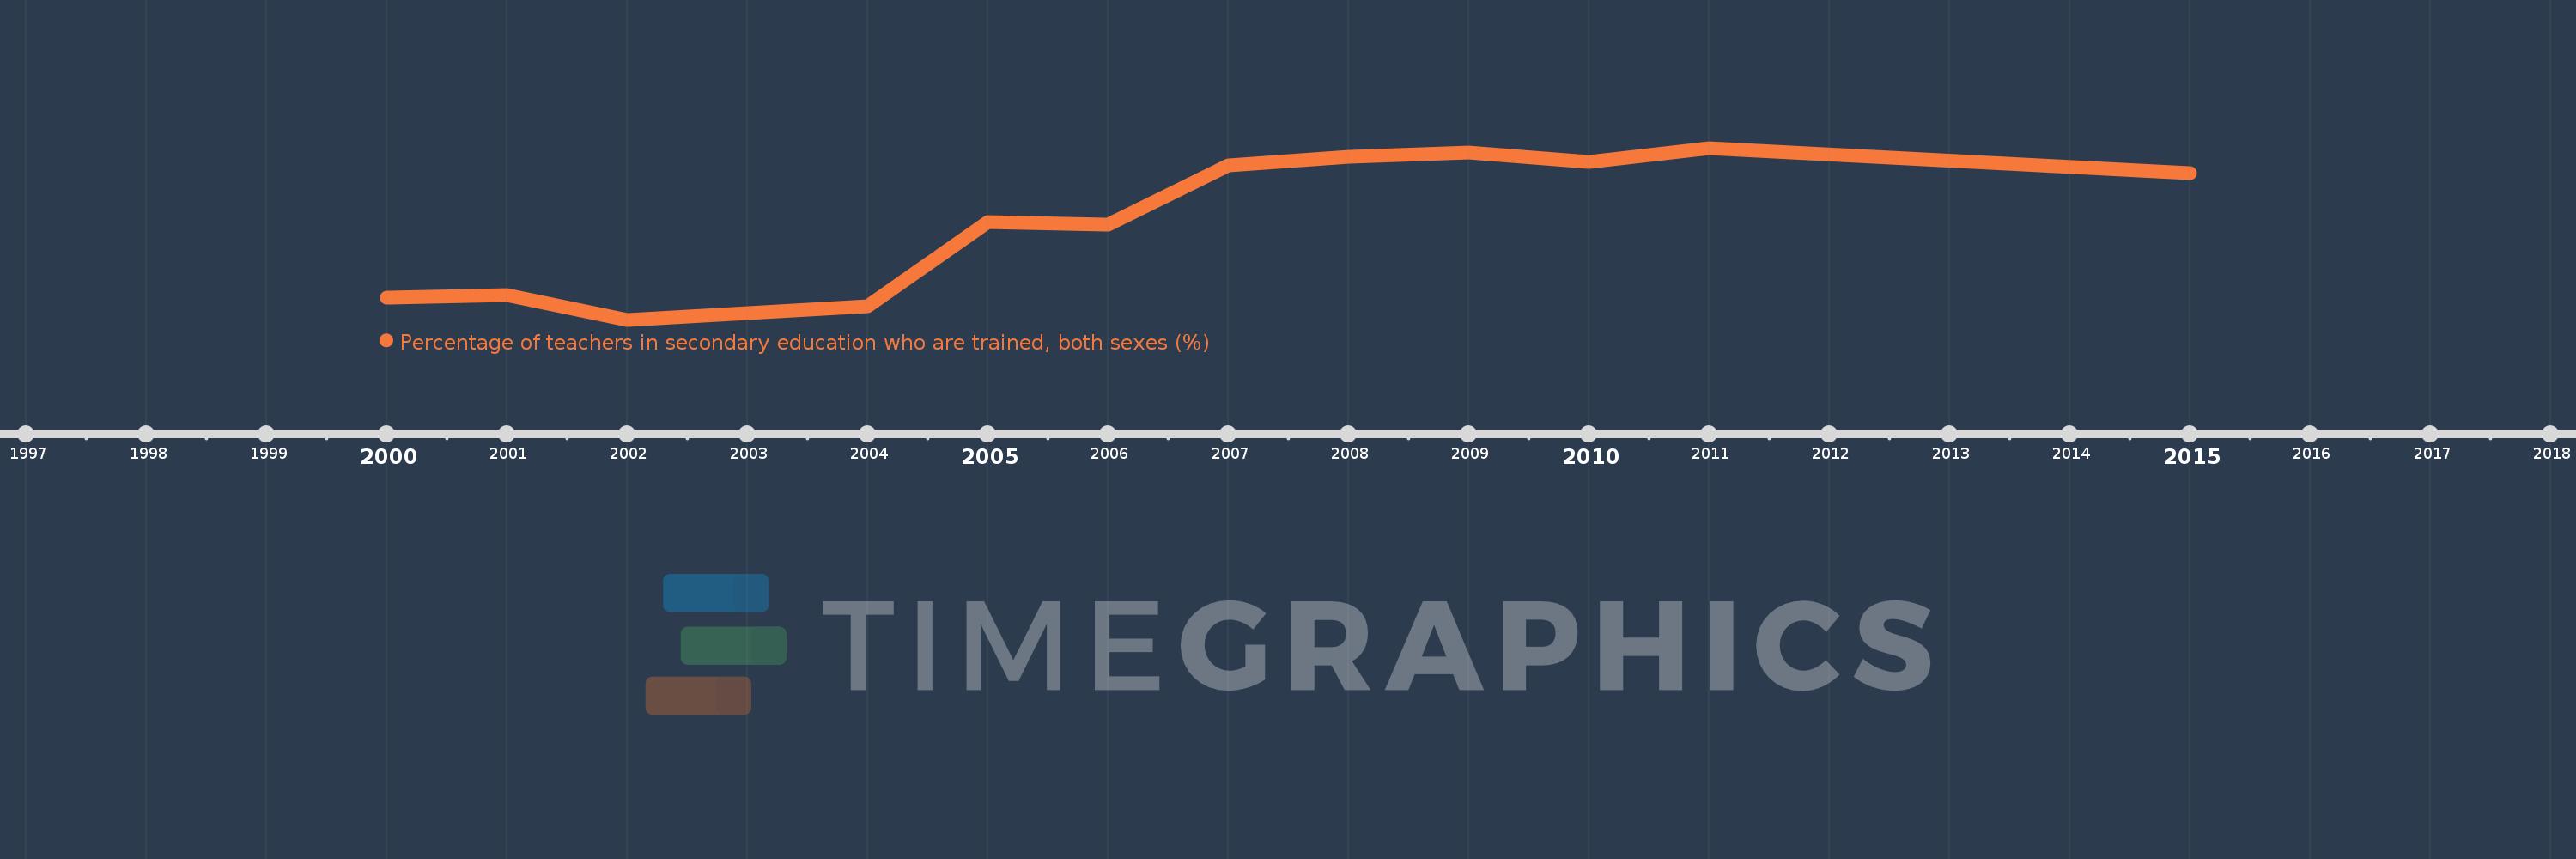
Percentage of teachers in secondary education who are trained, both sexes (%)
2015,2011,2010,2009,2008,2007,2006,2005,2004,2003,2002,2001,2000
This statistics in other country:
Timeline:
This timeline shows a graph from 2000 to 2015 of Myanmar. No data until 1999. Number of actual observations by date: 13.
Source name:
World Development Indicators
Source organization:
UNESCO Institute for Statistics
Categories, topics:
Education
Last updated:
apr 23, 2017
Indicators value changes by year
Maximum:
98.818
jan 1, 2011
At the date of observation
Value
Absolute change
Change from previous value
jan 1, 2000
69.478
+69.478
0.0%
jan 1, 2001
69.89
+0.411
0.59%
jan 1, 2002
65.08
-4.81
-6.88%
jan 1, 2003
66.42
+1.34
2.06%
jan 1, 2004
67.684
+1.263
1.9%
jan 1, 2005
84.305
+16.621
24.56%
jan 1, 2006
83.78
-0.525
-0.62%
jan 1, 2007
95.392
+11.612
13.86%
jan 1, 2008
97.099
+1.707
1.79%
jan 1, 2009
97.849
+0.75
0.77%
jan 1, 2010
96.05
-1.799
-1.84%
jan 1, 2011
98.818
+2.768
2.88%
jan 1, 2015
93.825
-4.993
-5.05%
Ranking of countries by current statistics by years


Comments: