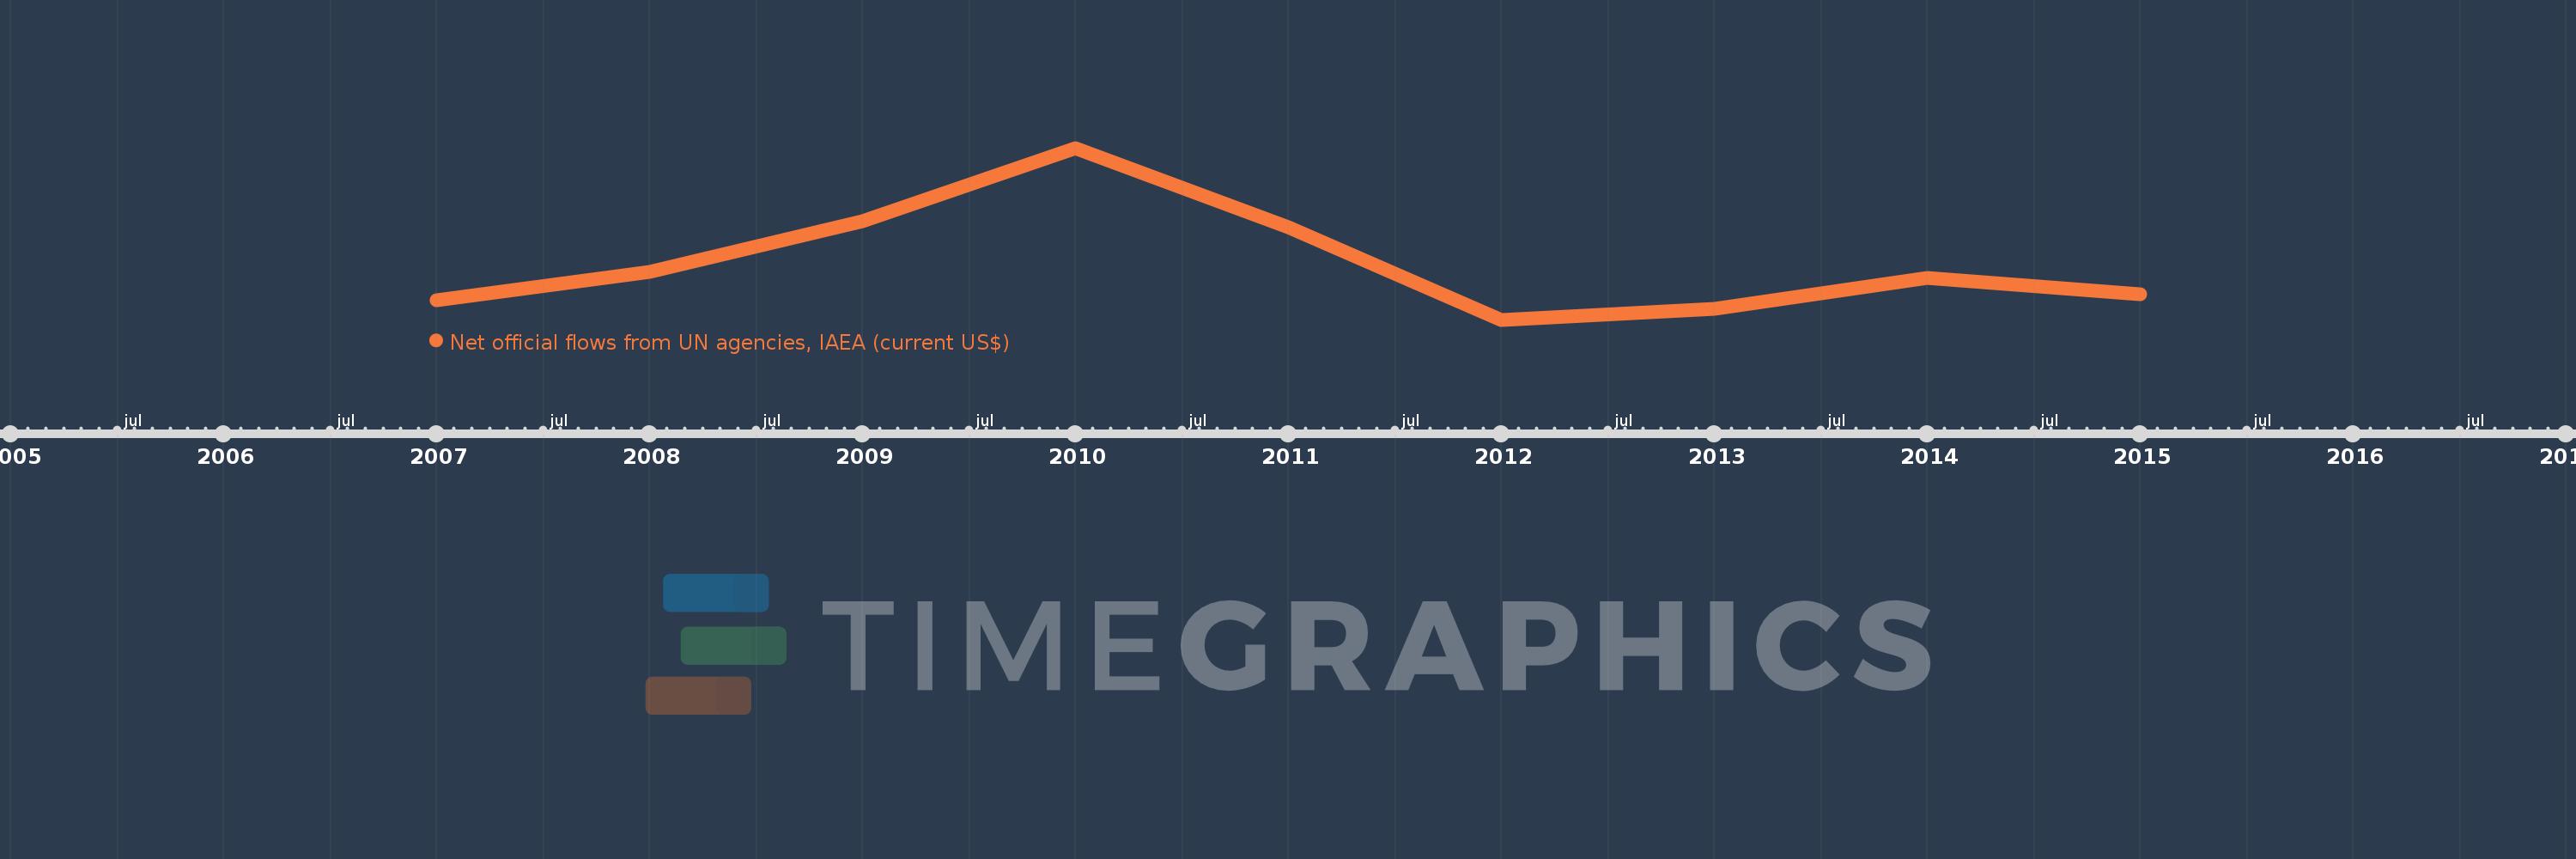
This timeline shows a graph from 2007 to 2015 of Burkina Faso. No data until 2006. Number of actual observations by date: 9.
Source name:
World Development Indicators
Source organization:
Development Assistance Committee of the Organisation for Economic Co-operation and Development, Geographical Distribution of Financial Flows to Developing Countries, Development Co-operation Report, and International Development Statistics database. Data are available online at: www.oecd.org/dac/stats/idsonline.
Categories, topics:
Aid Effectiveness
Last updated:
apr 23, 2017
Indicators value changes by year
Meaning:
391.111K
Minimum:
190.0K
jan 1, 2012
Maximum:
800.0K
jan 1, 2010
At the date of observation
Value
Absolute change
Change from the previous value
jan 1, 2007
260.0K
+260.0K
0.0%
jan 1, 2008
360.0K
+100.0K
38.46%
jan 1, 2009
540.0K
+180.0K
50.0%
jan 1, 2010
800.0K
+260.0K
48.15%
jan 1, 2011
520.0K
-280.0K
-35.0%
jan 1, 2012
190.0K
-330.0K
-63.46%
jan 1, 2013
230.0K
+40.0K
21.05%
jan 1, 2014
340.0K
+110.0K
47.83%
jan 1, 2015
280.0K
-60.0K
-17.65%
Ranking of countries by current statistics by years