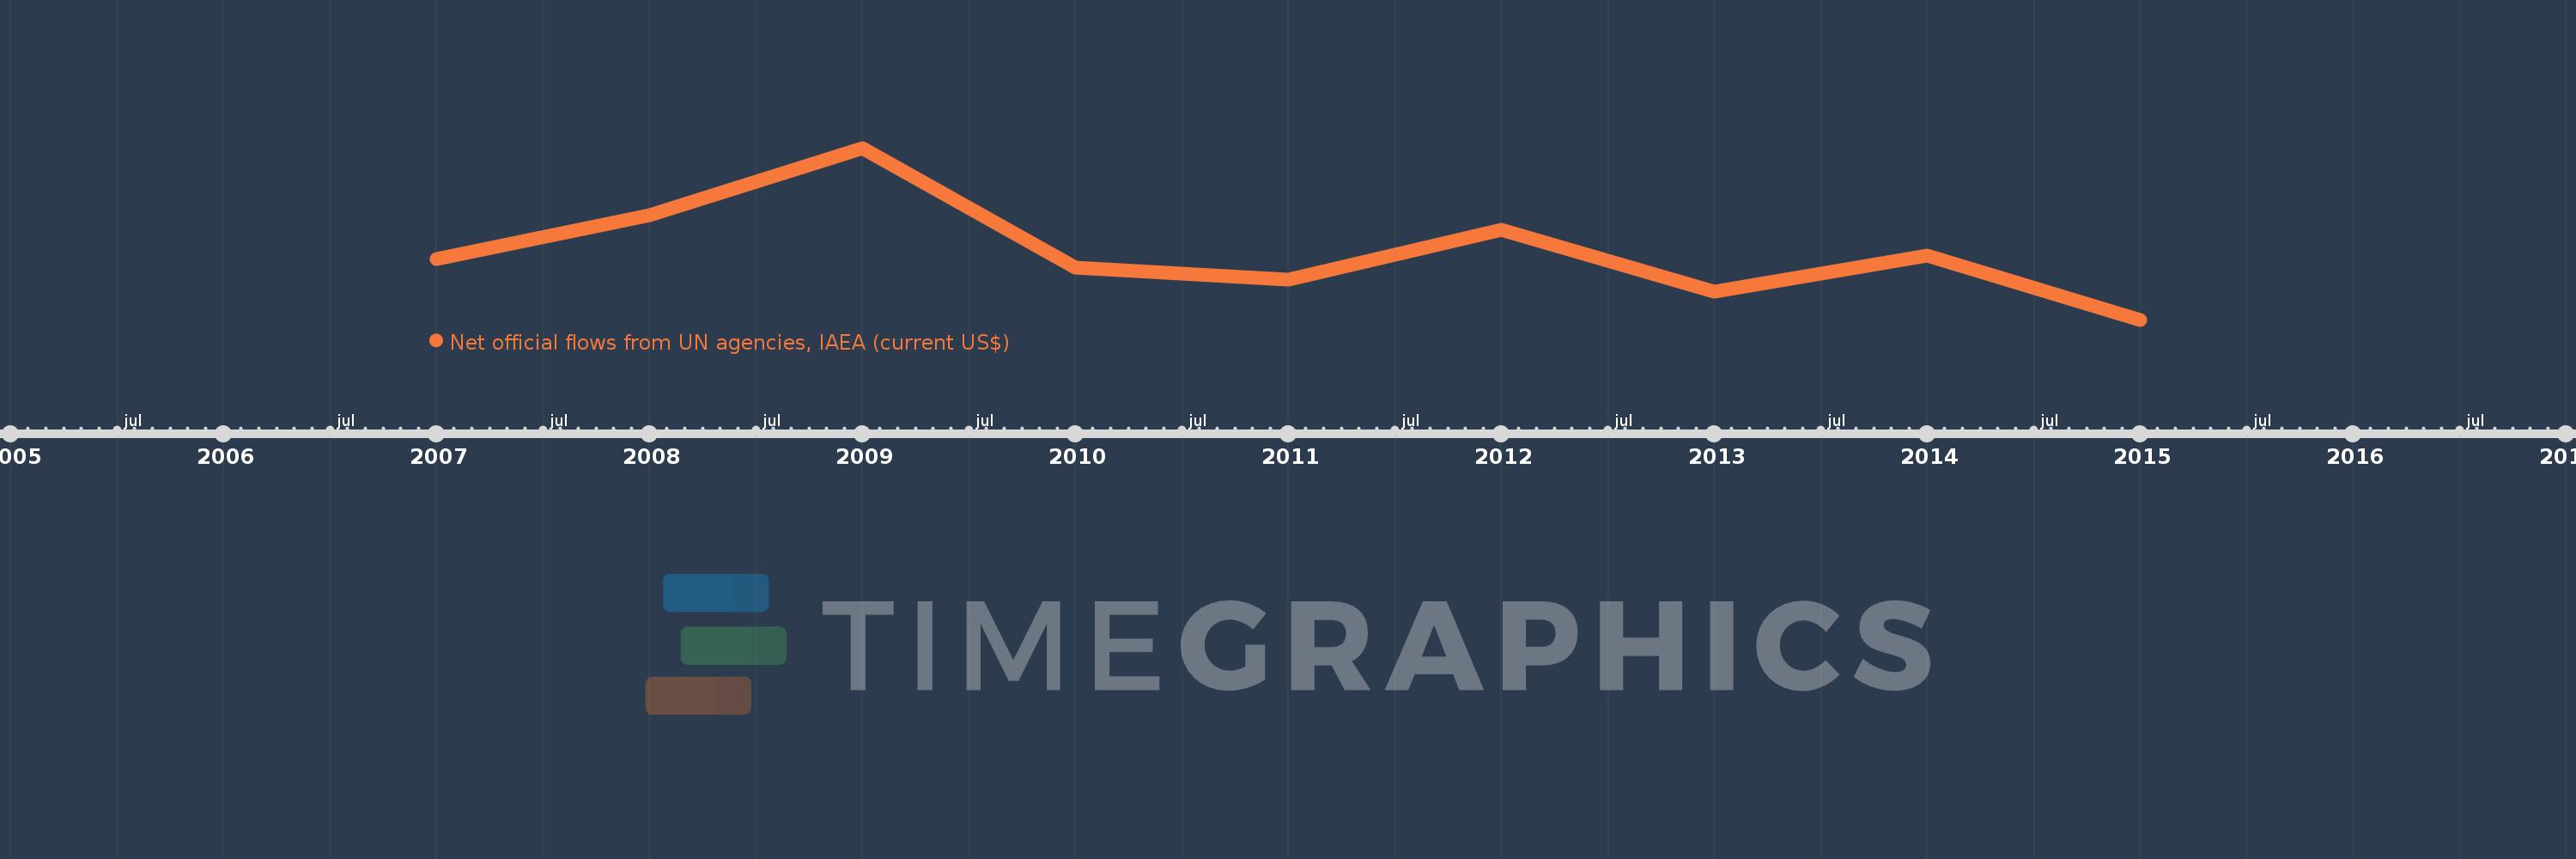
This timeline shows a graph from 2007 to 2015 of Ukraine. No data until 2006. Number of actual observations by date: 9.
Source name:
World Development Indicators
Source organization:
Development Assistance Committee of the Organisation for Economic Co-operation and Development, Geographical Distribution of Financial Flows to Developing Countries, Development Co-operation Report, and International Development Statistics database. Data are available online at: www.oecd.org/dac/stats/idsonline.
Categories, topics:
Aid Effectiveness
Last updated:
apr 23, 2017
Indicators value changes by year
Meaning:
793.333K
Minimum:
220.0K
jan 1, 2015
Maximum:
1.67 mln
jan 1, 2009
At the date of observation
Value
Absolute change
Change from the previous value
jan 1, 2007
730.0K
+730.0K
0.0%
jan 1, 2008
1.1 mln
+370.0K
50.68%
jan 1, 2009
1.67 mln
+570.0K
51.82%
jan 1, 2010
660.0K
-1.01 mln
-60.48%
jan 1, 2011
560.0K
-100.0K
-15.15%
jan 1, 2012
980.0K
+420.0K
75.0%
jan 1, 2013
460.0K
-520.0K
-53.06%
jan 1, 2014
760.0K
+300.0K
65.22%
jan 1, 2015
220.0K
-540.0K
-71.05%
Ranking of countries by current statistics by years