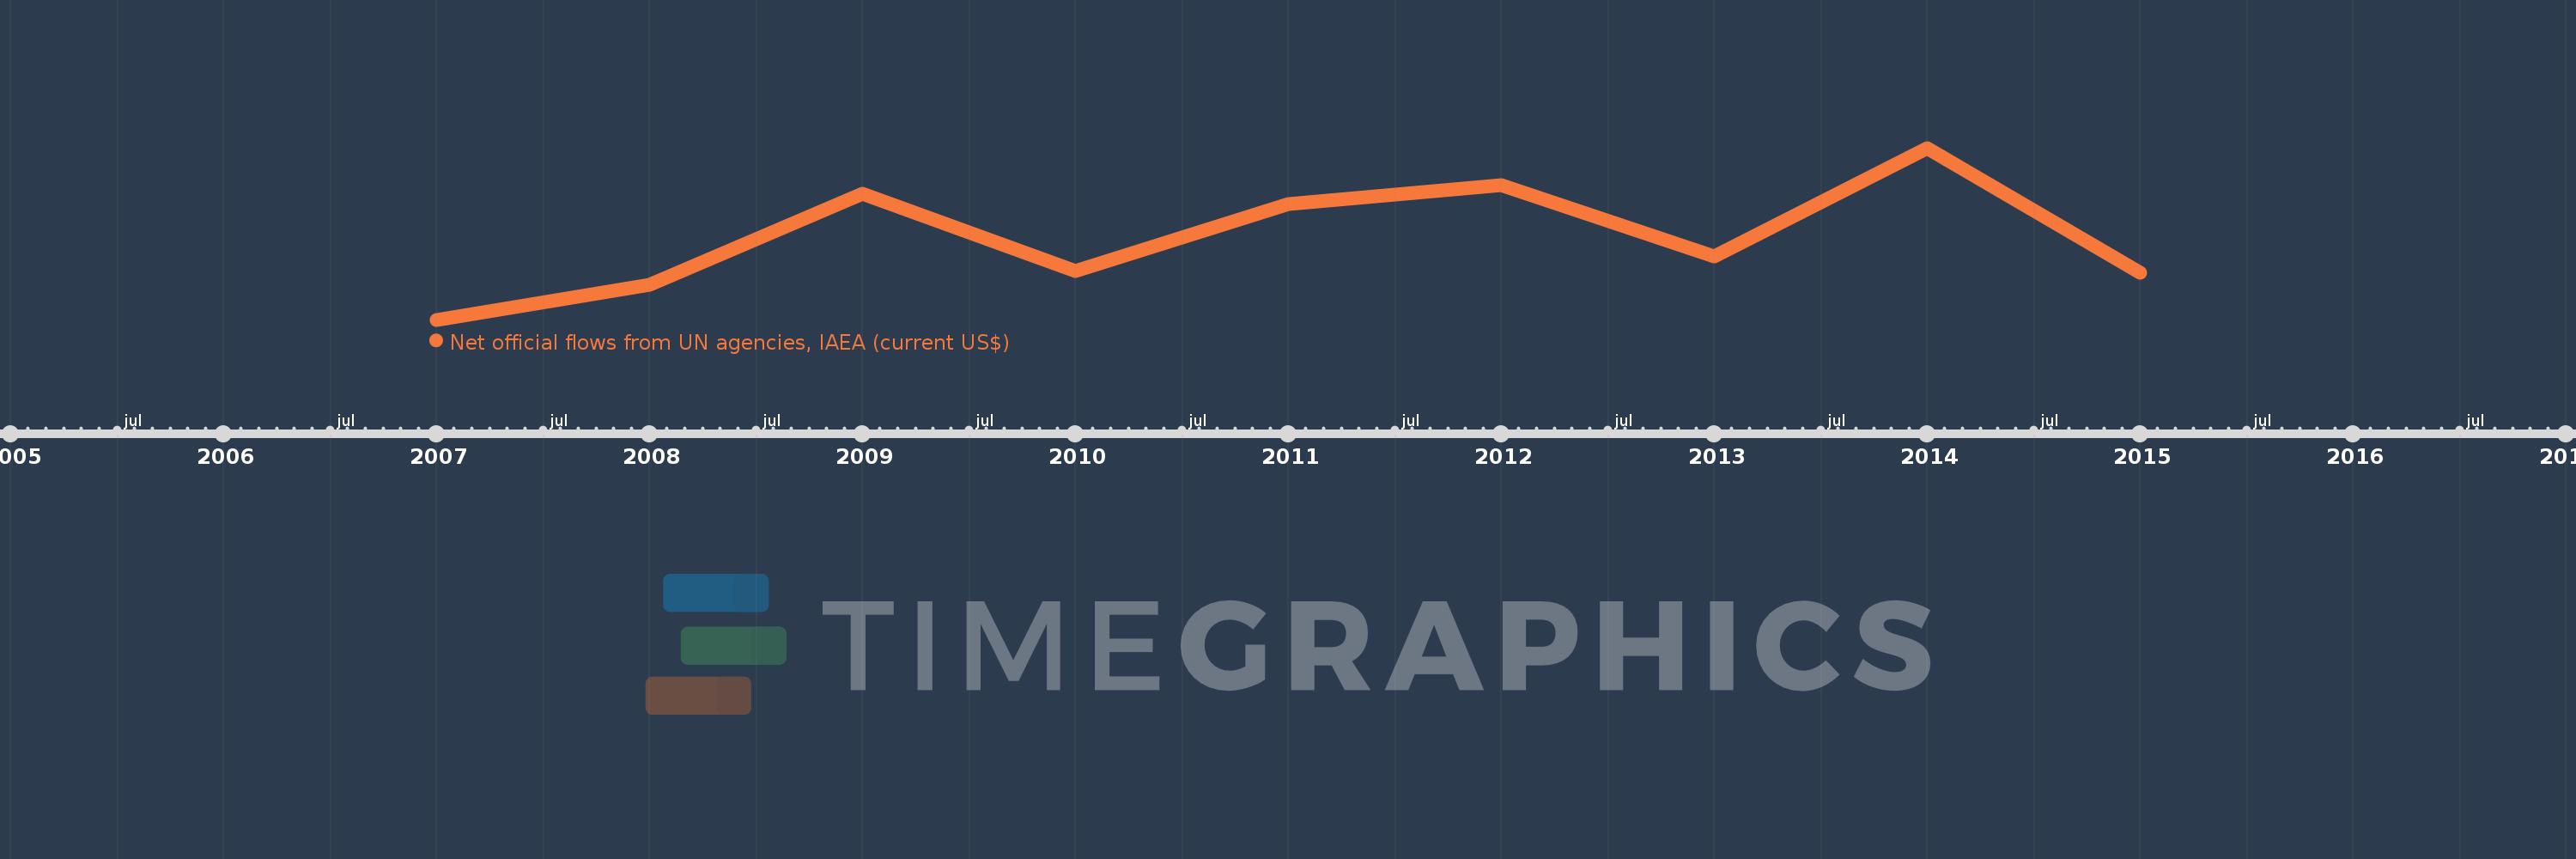
This timeline shows a graph from 2007 to 2015 of Lebanon. No data until 2006. Number of actual observations by date: 9.
Source name:
World Development Indicators
Source organization:
Development Assistance Committee of the Organisation for Economic Co-operation and Development, Geographical Distribution of Financial Flows to Developing Countries, Development Co-operation Report, and International Development Statistics database. Data are available online at: www.oecd.org/dac/stats/idsonline.
Categories, topics:
Aid Effectiveness
Last updated:
apr 23, 2017
Indicators value changes by year
Meaning:
541.111K
Minimum:
70.0K
jan 1, 2007
Maximum:
1.05 mln
jan 1, 2014
At the date of observation
Value
Absolute change
Change from the previous value
jan 1, 2007
70.0K
+70.0K
0.0%
jan 1, 2008
270.0K
+200.0K
285.71%
jan 1, 2009
790.0K
+520.0K
192.59%
jan 1, 2010
350.0K
-440.0K
-55.7%
jan 1, 2011
730.0K
+380.0K
108.57%
jan 1, 2012
840.0K
+110.0K
15.07%
jan 1, 2013
430.0K
-410.0K
-48.81%
jan 1, 2014
1.05 mln
+620.0K
144.19%
jan 1, 2015
340.0K
-710.0K
-67.62%
Ranking of countries by current statistics by years