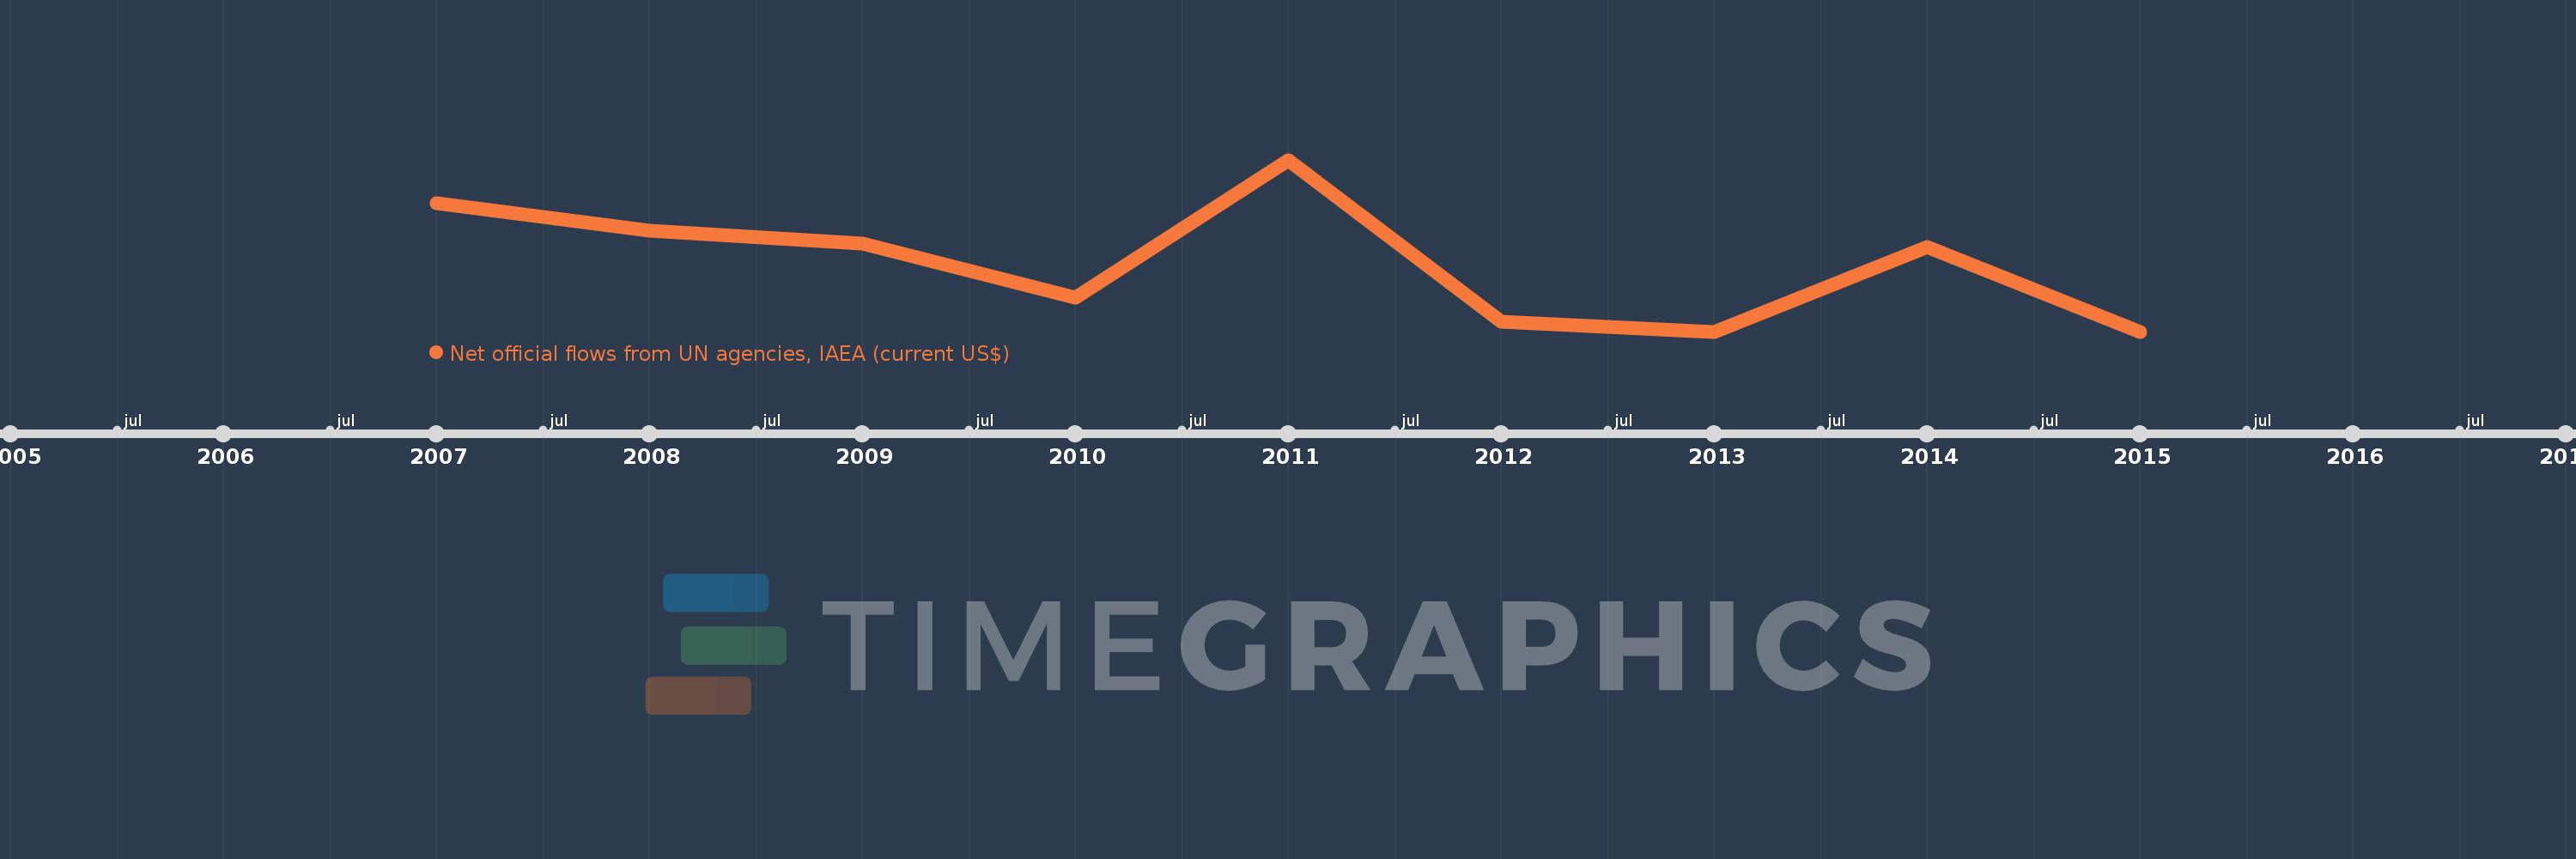
This timeline shows a graph from 2007 to 2015 of Serbia. No data until 2006. Number of actual observations by date: 9.
Source name:
World Development Indicators
Source organization:
Development Assistance Committee of the Organisation for Economic Co-operation and Development, Geographical Distribution of Financial Flows to Developing Countries, Development Co-operation Report, and International Development Statistics database. Data are available online at: www.oecd.org/dac/stats/idsonline.
Categories, topics:
Aid Effectiveness
Last updated:
apr 23, 2017
Indicators value changes by year
Meaning:
745.556K
Minimum:
10.0K
jan 1, 2013
Maximum:
1.85 mln
jan 1, 2011
At the date of observation
Value
Absolute change
Change from the previous value
jan 1, 2007
1.39 mln
+1.39 mln
0.0%
jan 1, 2008
1.09 mln
-300.0K
-21.58%
jan 1, 2009
950.0K
-140.0K
-12.84%
jan 1, 2010
370.0K
-580.0K
-61.05%
jan 1, 2011
1.85 mln
+1.48 mln
400.0%
jan 1, 2012
120.0K
-1.73 mln
-93.51%
jan 1, 2013
10.0K
-110.0K
-91.67%
jan 1, 2014
920.0K
+910.0K
9.1K%
jan 1, 2015
10.0K
-910.0K
-98.91%
Ranking of countries by current statistics by years