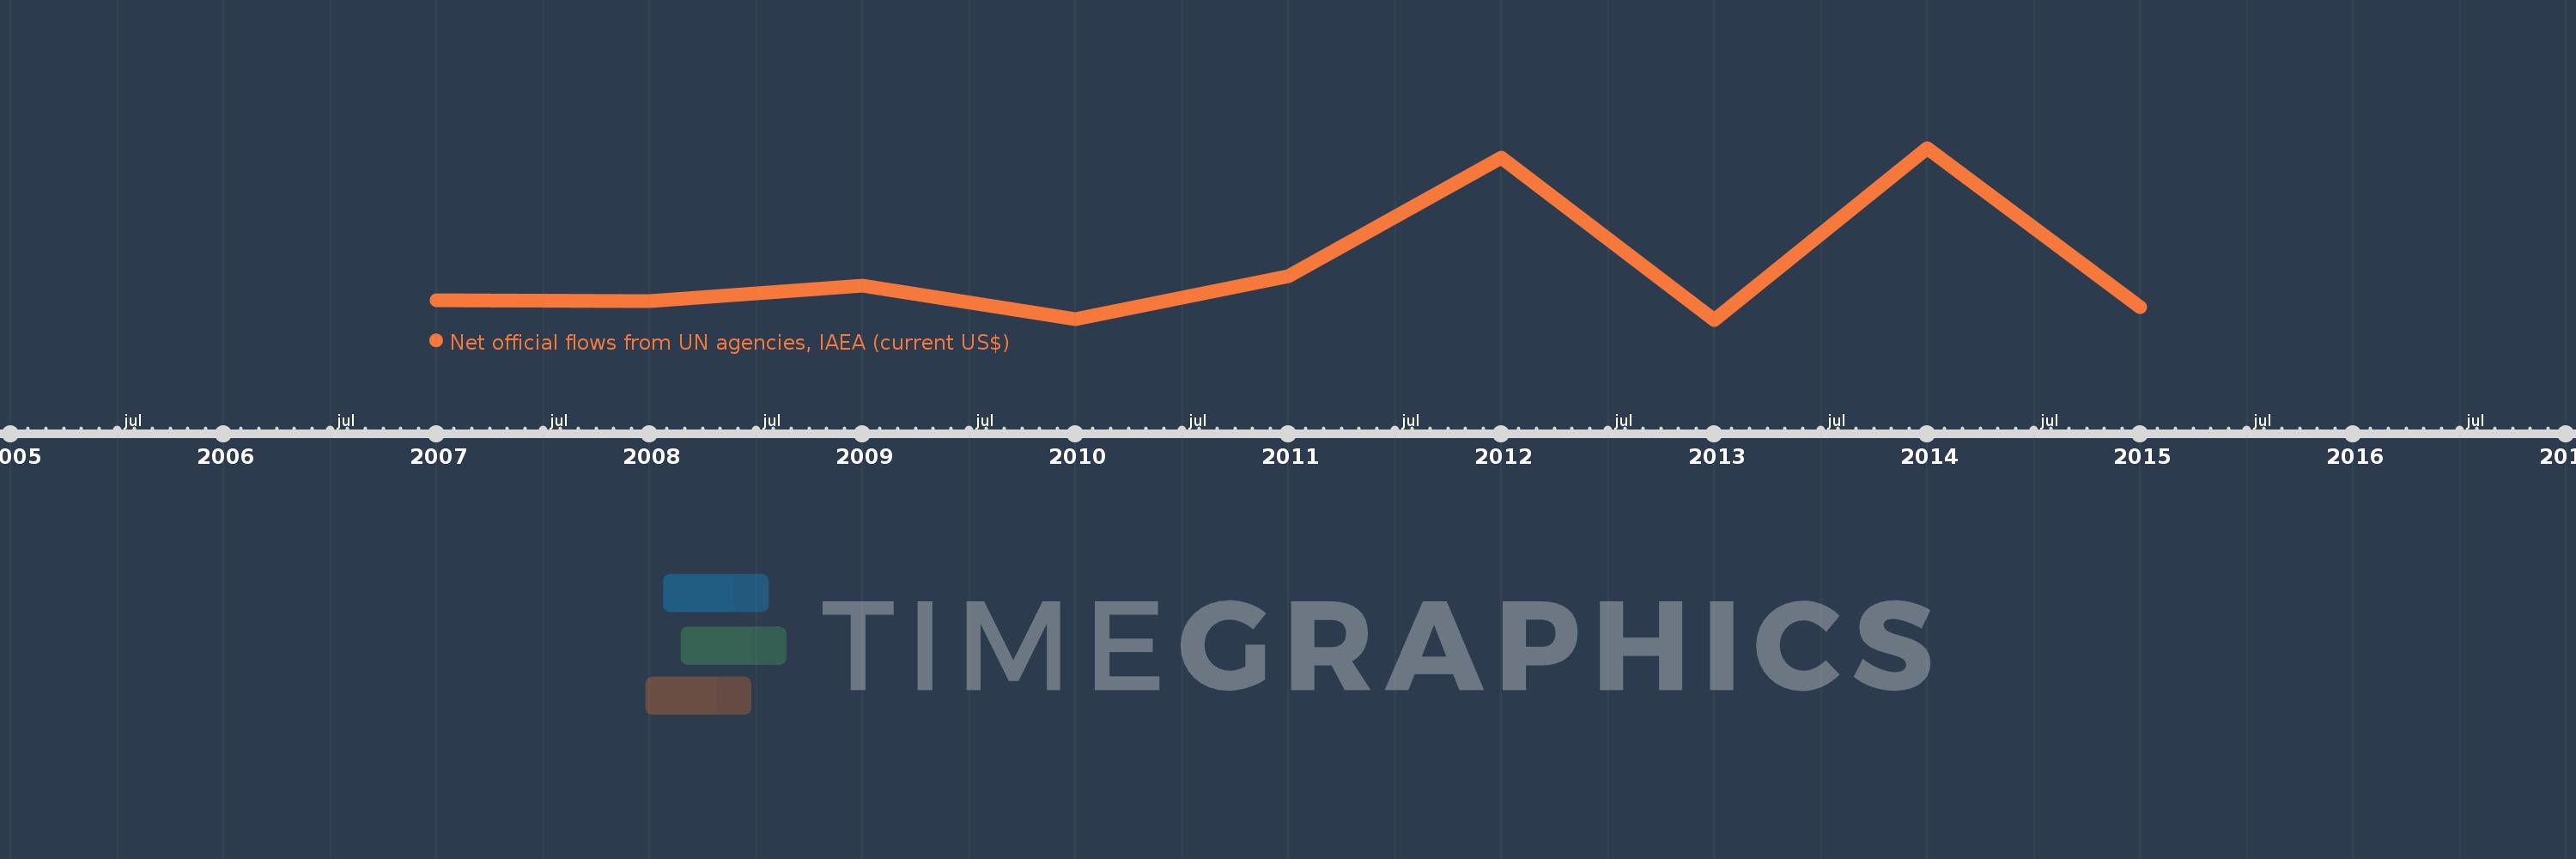
This timeline shows a graph from 2007 to 2015 of East Asia & Pacific (excluding high income). No data until 2006. Number of actual observations by date: 9.
Source name:
World Development Indicators
Source organization:
Development Assistance Committee of the Organisation for Economic Co-operation and Development, Geographical Distribution of Financial Flows to Developing Countries, Development Co-operation Report, and International Development Statistics database. Data are available online at: www.oecd.org/dac/stats/idsonline.
Categories, topics:
Aid Effectiveness
Last updated:
apr 23, 2017
Indicators value changes by year
Meaning:
6.499 mln
Minimum:
4.17 mln
jan 1, 2013
Maximum:
11.94 mln
jan 1, 2014
At the date of observation
Value
Absolute change
Change from the previous value
jan 1, 2007
5.05 mln
+5.05 mln
0.0%
jan 1, 2008
5.01 mln
-40.0K
-0.79%
jan 1, 2009
5.73 mln
+720.0K
14.37%
jan 1, 2010
4.19 mln
-1.54 mln
-26.88%
jan 1, 2011
6.13 mln
+1.94 mln
46.3%
jan 1, 2012
11.52 mln
+5.39 mln
87.93%
jan 1, 2013
4.17 mln
-7.35 mln
-63.8%
jan 1, 2014
11.94 mln
+7.77 mln
186.33%
jan 1, 2015
4.75 mln
-7.19 mln
-60.22%
Ranking of countries by current statistics by years