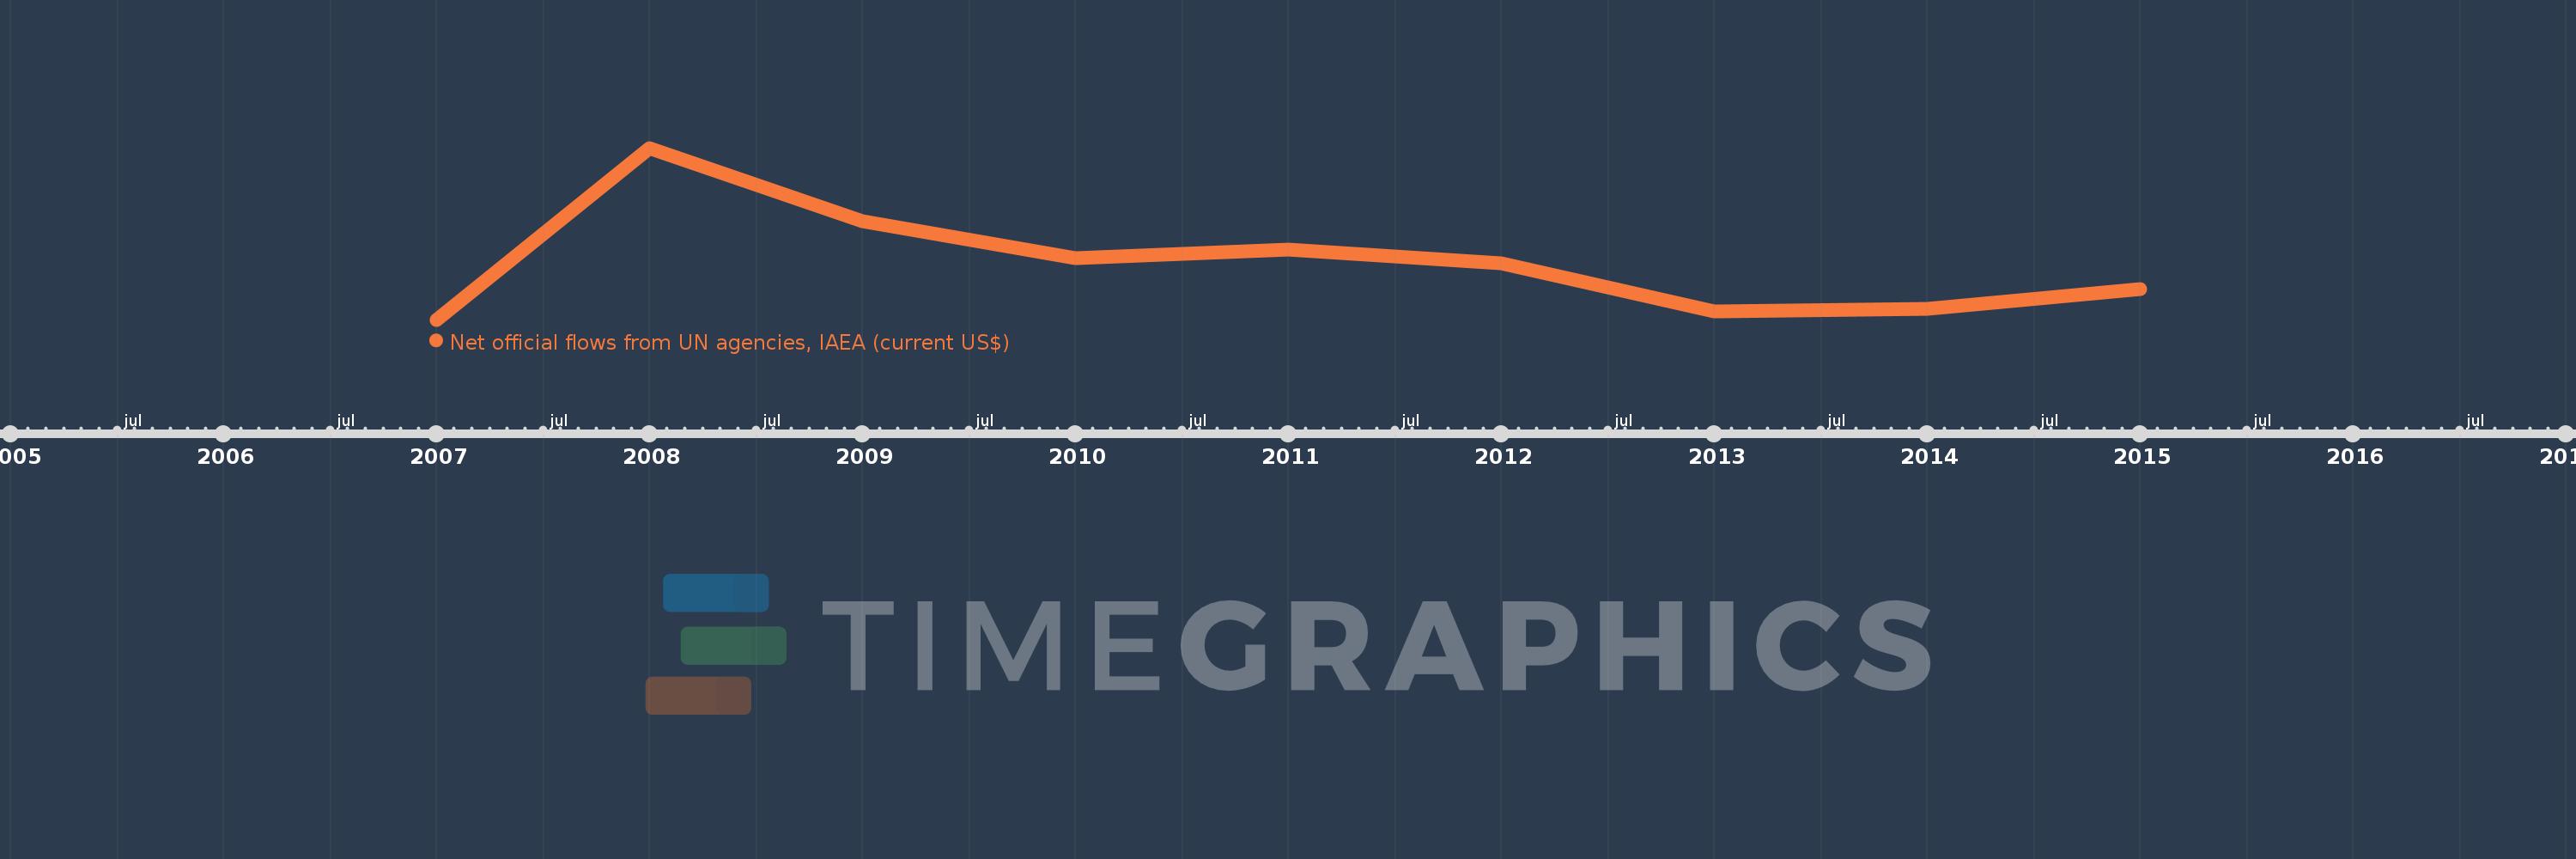
This timeline shows a graph from 2007 to 2015 of Mali. No data until 2006. Number of actual observations by date: 9.
Source name:
World Development Indicators
Source organization:
Development Assistance Committee of the Organisation for Economic Co-operation and Development, Geographical Distribution of Financial Flows to Developing Countries, Development Co-operation Report, and International Development Statistics database. Data are available online at: www.oecd.org/dac/stats/idsonline.
Categories, topics:
Aid Effectiveness
Last updated:
apr 23, 2017
Indicators value changes by year
Meaning:
381.111K
Minimum:
180.0K
jan 1, 2007
Maximum:
790.0K
jan 1, 2008
At the date of observation
Value
Absolute change
Change from the previous value
jan 1, 2007
180.0K
+180.0K
0.0%
jan 1, 2008
790.0K
+610.0K
338.89%
jan 1, 2009
530.0K
-260.0K
-32.91%
jan 1, 2010
400.0K
-130.0K
-24.53%
jan 1, 2011
430.0K
+30.0K
7.5%
jan 1, 2012
380.0K
-50.0K
-11.63%
jan 1, 2013
210.0K
-170.0K
-44.74%
jan 1, 2014
220.0K
+10.0K
4.76%
jan 1, 2015
290.0K
+70.0K
31.82%
Ranking of countries by current statistics by years