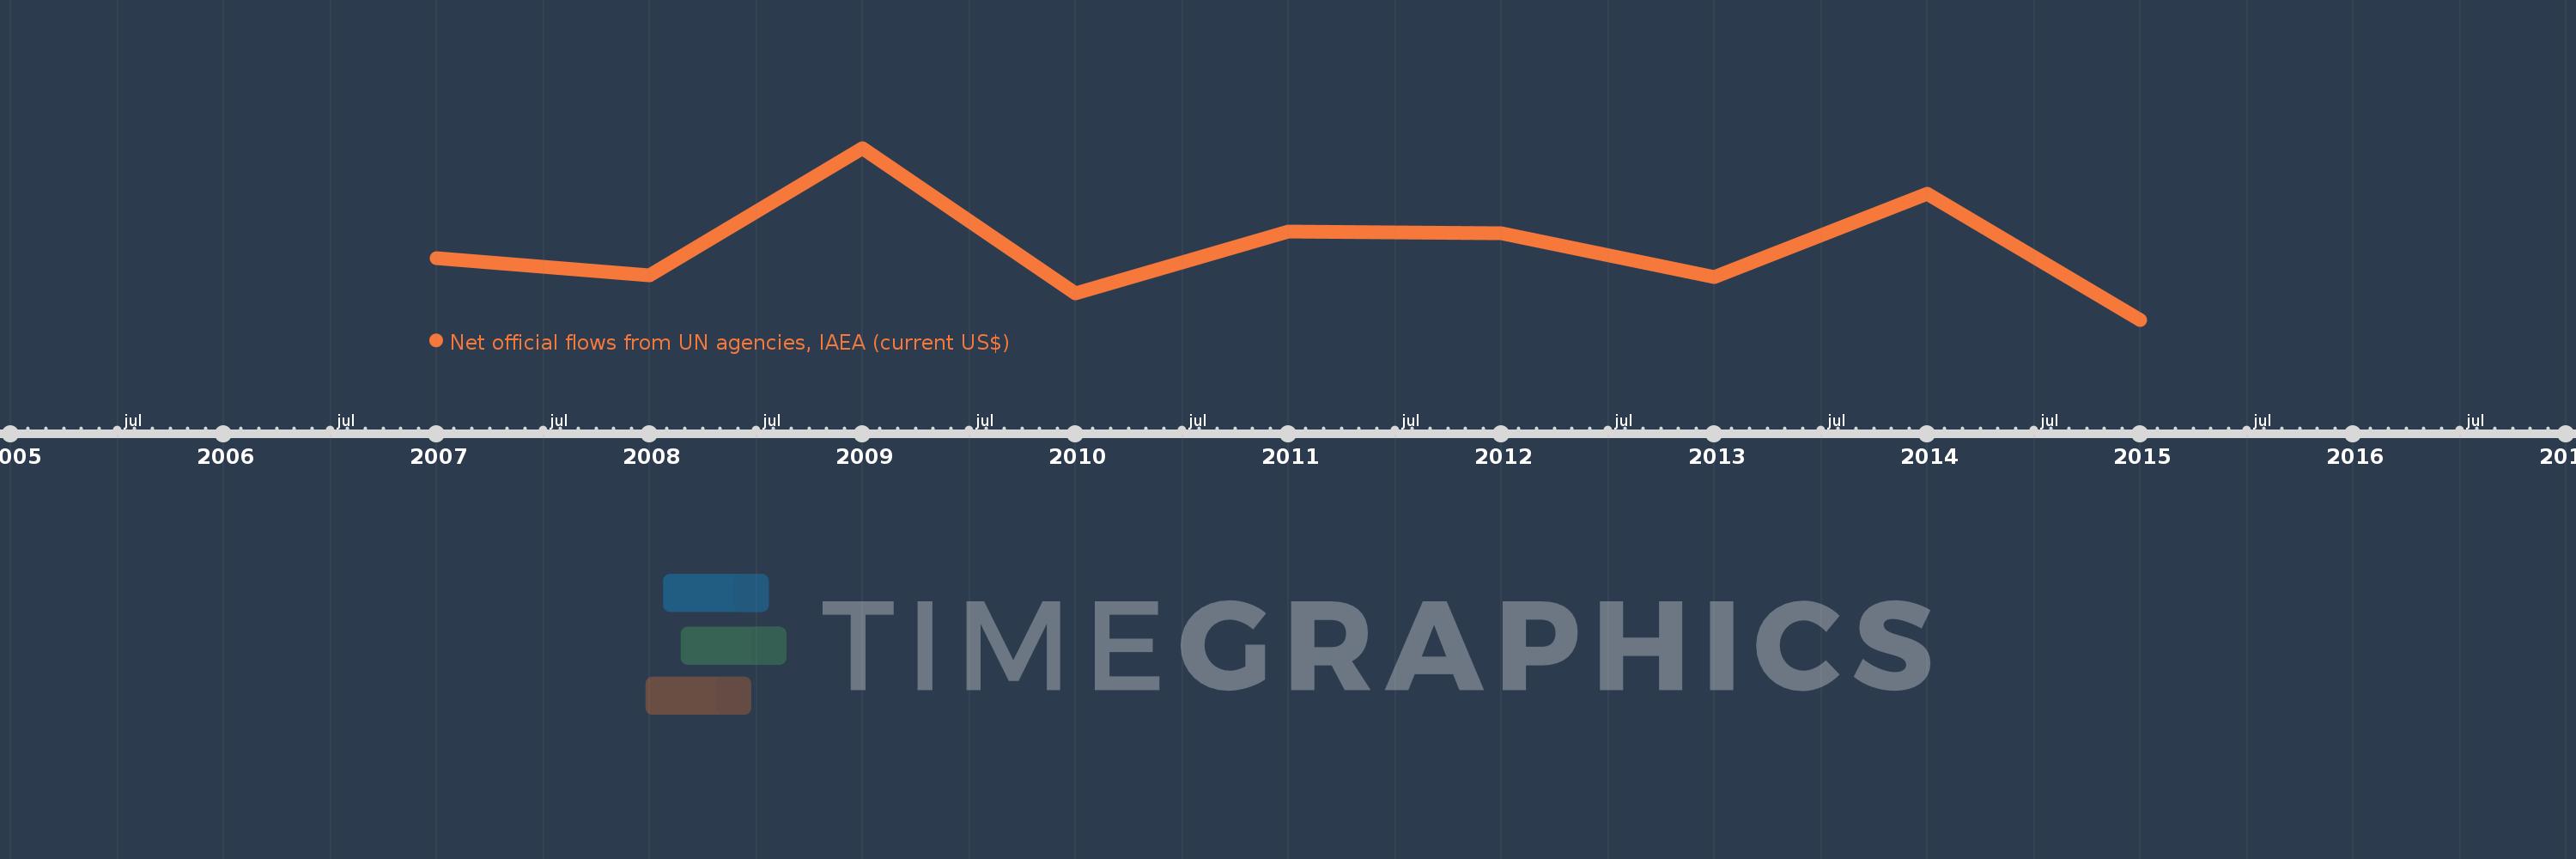
This timeline shows a graph from 2007 to 2015 of Moldova. No data until 2006. Number of actual observations by date: 9.
Source name:
World Development Indicators
Source organization:
Development Assistance Committee of the Organisation for Economic Co-operation and Development, Geographical Distribution of Financial Flows to Developing Countries, Development Co-operation Report, and International Development Statistics database. Data are available online at: www.oecd.org/dac/stats/idsonline.
Categories, topics:
Aid Effectiveness
Last updated:
apr 23, 2017
Indicators value changes by year
Meaning:
686.667K
Minimum:
230.0K
jan 1, 2015
Maximum:
1.32 mln
jan 1, 2009
At the date of observation
Value
Absolute change
Change from the previous value
jan 1, 2007
620.0K
+620.0K
0.0%
jan 1, 2008
510.0K
-110.0K
-17.74%
jan 1, 2009
1.32 mln
+810.0K
158.82%
jan 1, 2010
400.0K
-920.0K
-69.7%
jan 1, 2011
790.0K
+390.0K
97.5%
jan 1, 2012
780.0K
-10.0K
-1.27%
jan 1, 2013
500.0K
-280.0K
-35.9%
jan 1, 2014
1.03 mln
+530.0K
106.0%
jan 1, 2015
230.0K
-800.0K
-77.67%
Ranking of countries by current statistics by years