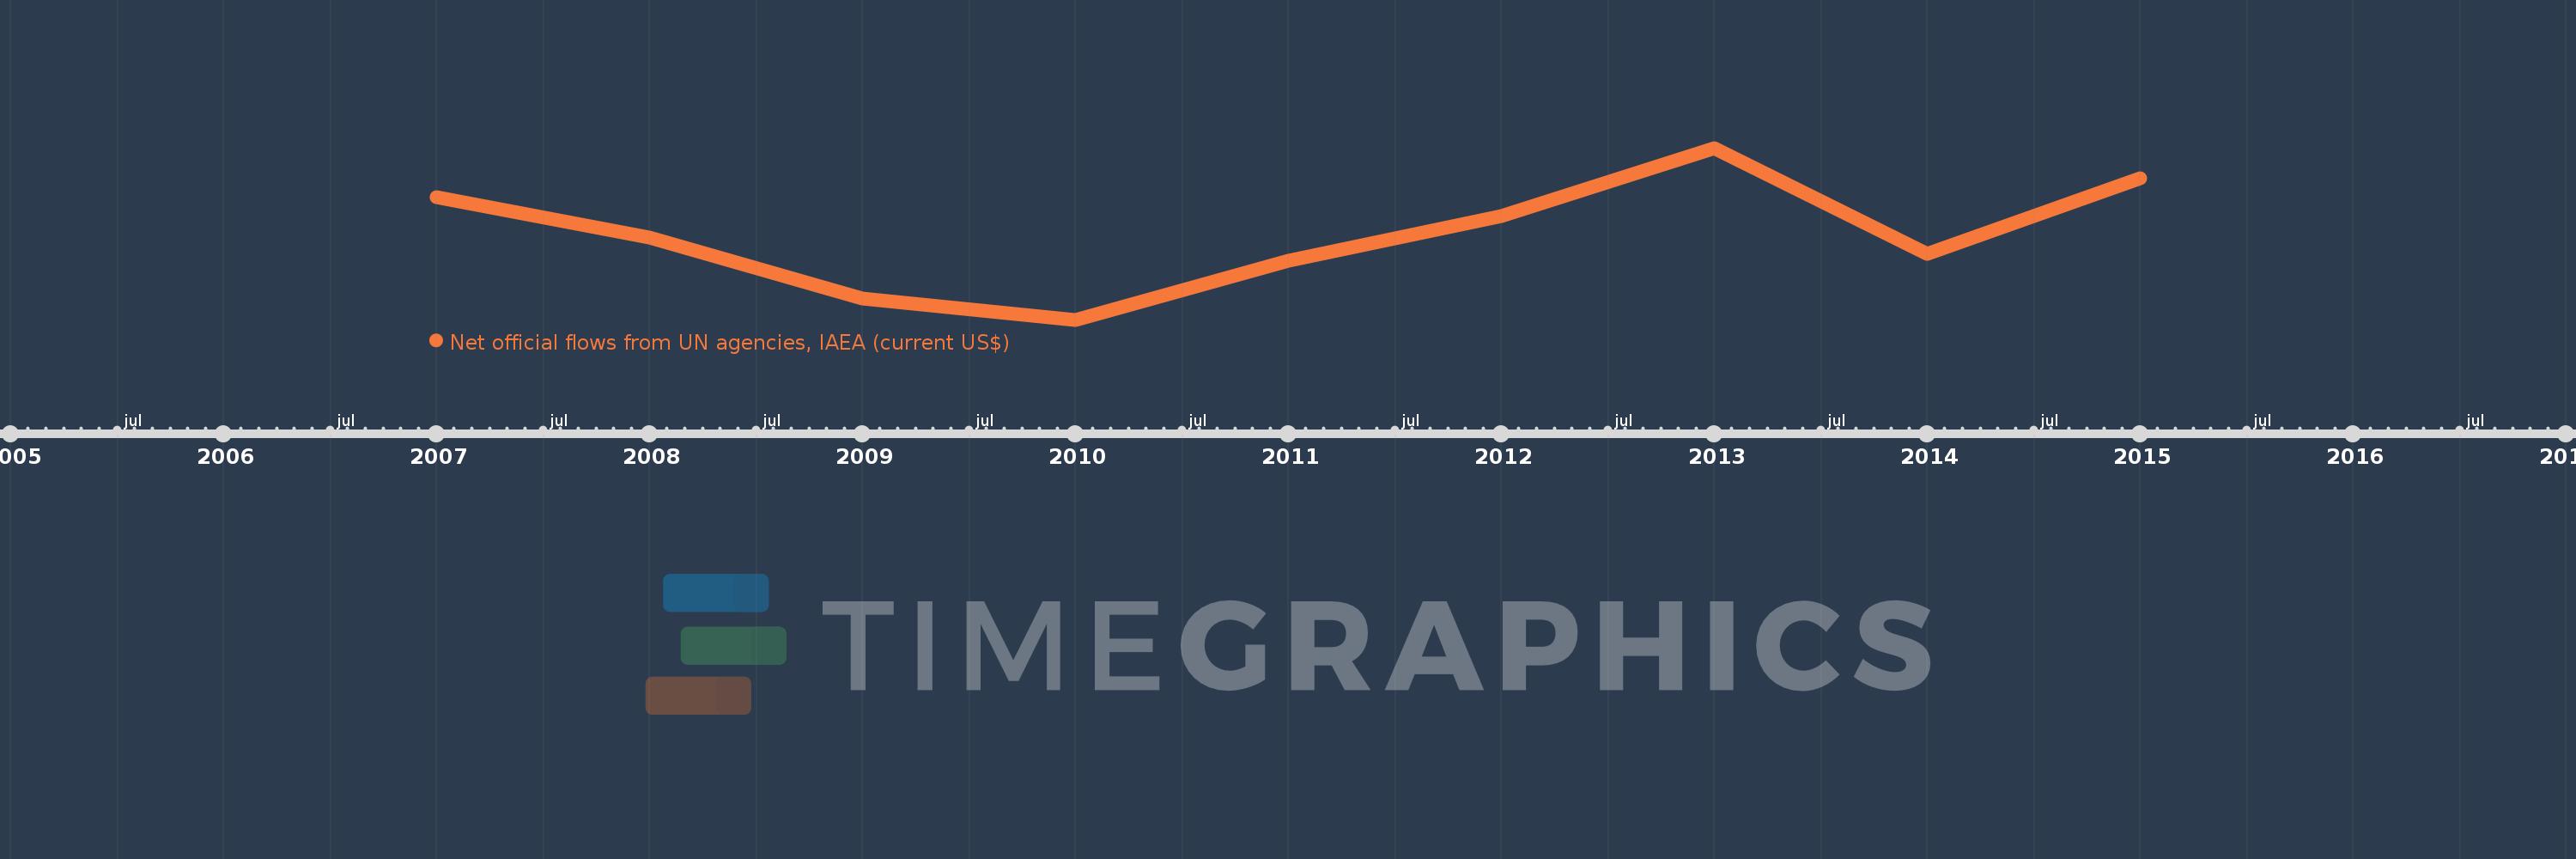
This timeline shows a graph from 2007 to 2015 of Uzbekistan. No data until 2006. Number of actual observations by date: 9.
Source name:
World Development Indicators
Source organization:
Development Assistance Committee of the Organisation for Economic Co-operation and Development, Geographical Distribution of Financial Flows to Developing Countries, Development Co-operation Report, and International Development Statistics database. Data are available online at: www.oecd.org/dac/stats/idsonline.
Categories, topics:
Aid Effectiveness
Last updated:
apr 23, 2017
Indicators value changes by year
Meaning:
502.222K
Minimum:
140.0K
jan 1, 2010
Maximum:
870.0K
jan 1, 2013
At the date of observation
Value
Absolute change
Change from the previous value
jan 1, 2007
660.0K
+660.0K
0.0%
jan 1, 2008
490.0K
-170.0K
-25.76%
jan 1, 2009
230.0K
-260.0K
-53.06%
jan 1, 2010
140.0K
-90.0K
-39.13%
jan 1, 2011
390.0K
+250.0K
178.57%
jan 1, 2012
580.0K
+190.0K
48.72%
jan 1, 2013
870.0K
+290.0K
50.0%
jan 1, 2014
420.0K
-450.0K
-51.72%
jan 1, 2015
740.0K
+320.0K
76.19%
Ranking of countries by current statistics by years