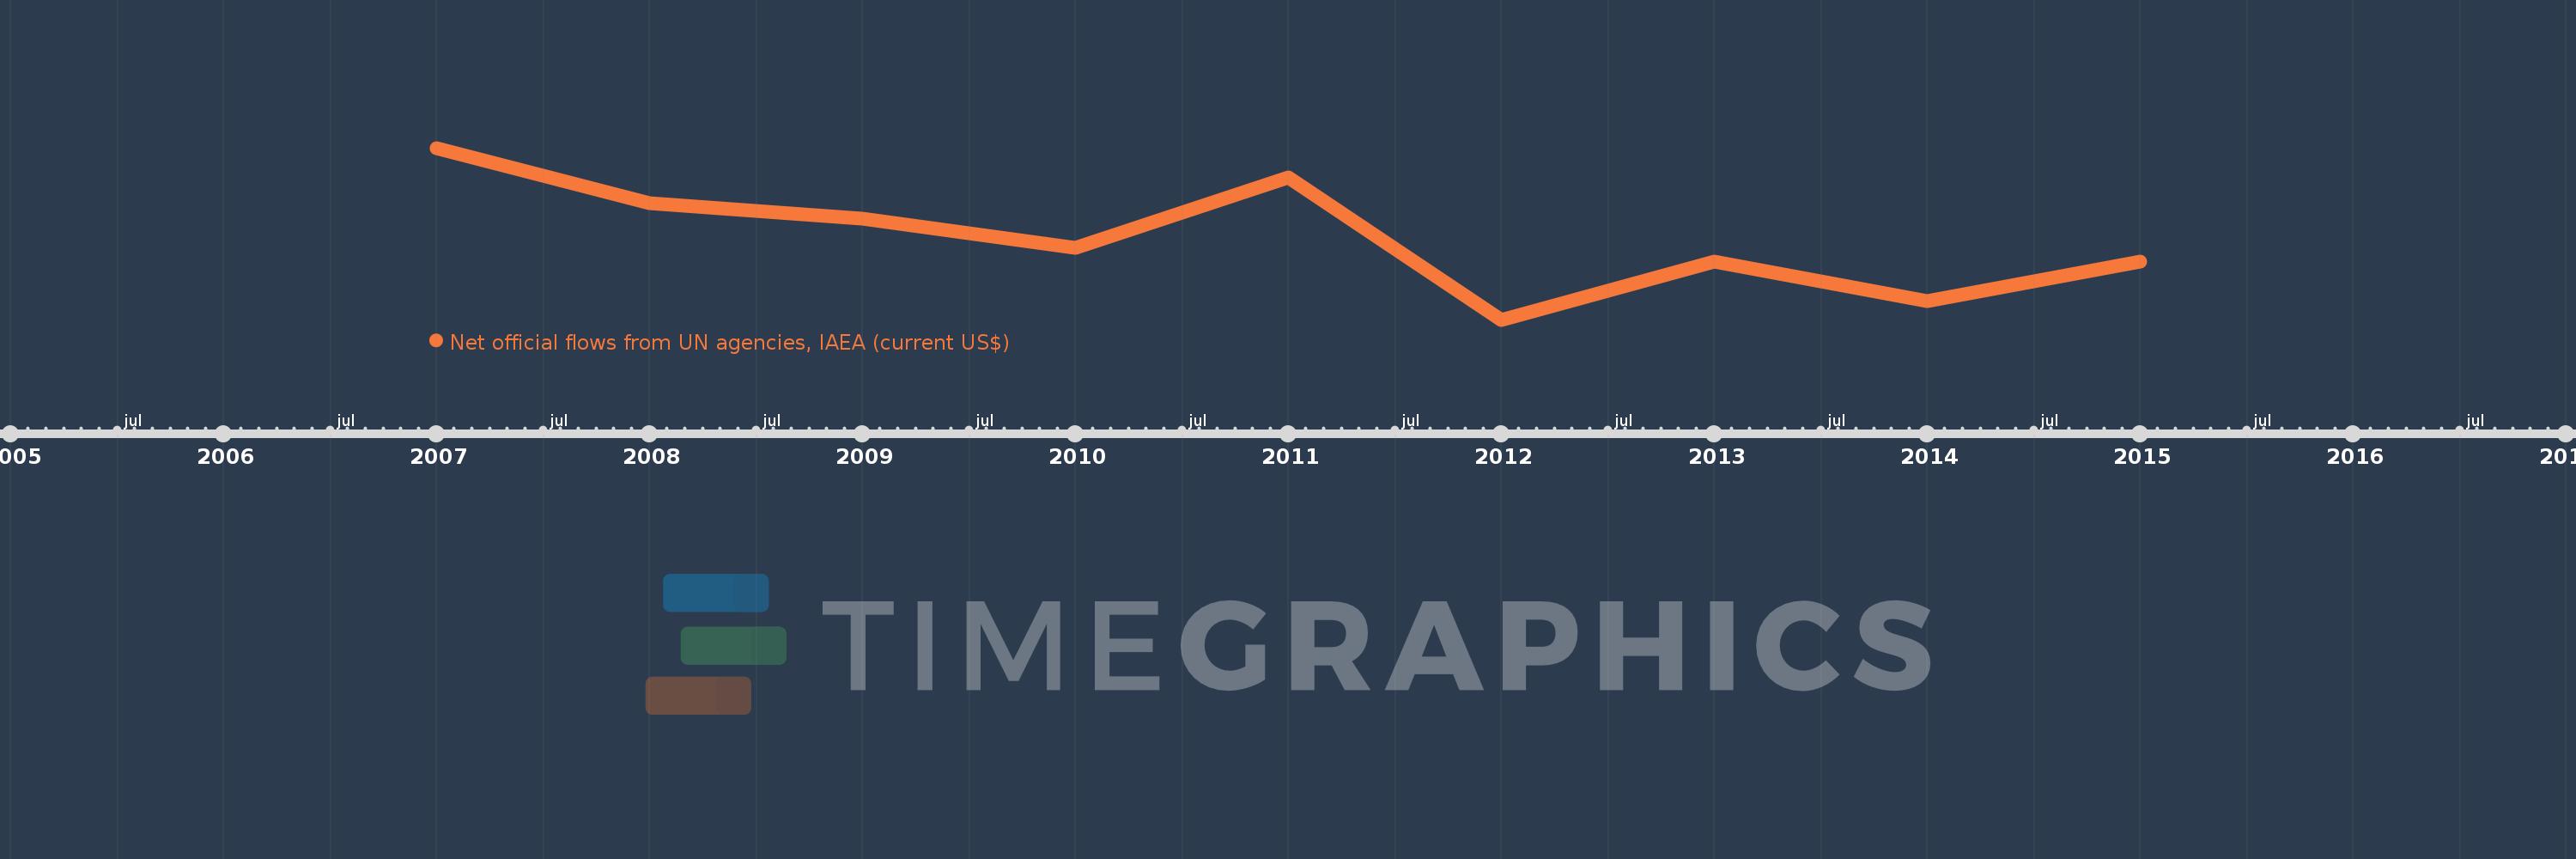
This timeline shows a graph from 2007 to 2015 of Algeria. No data until 2006. Number of actual observations by date: 9.
Source name:
World Development Indicators
Source organization:
Development Assistance Committee of the Organisation for Economic Co-operation and Development, Geographical Distribution of Financial Flows to Developing Countries, Development Co-operation Report, and International Development Statistics database. Data are available online at: www.oecd.org/dac/stats/idsonline.
Categories, topics:
Aid Effectiveness
Last updated:
apr 23, 2017
Indicators value changes by year
Meaning:
778.889K
Minimum:
300.0K
jan 1, 2012
Maximum:
1.3 mln
jan 1, 2007
At the date of observation
Value
Absolute change
Change from the previous value
jan 1, 2007
1.3 mln
+1.3 mln
0.0%
jan 1, 2008
980.0K
-320.0K
-24.62%
jan 1, 2009
890.0K
-90.0K
-9.18%
jan 1, 2010
720.0K
-170.0K
-19.1%
jan 1, 2011
1.13 mln
+410.0K
56.94%
jan 1, 2012
300.0K
-830.0K
-73.45%
jan 1, 2013
640.0K
+340.0K
113.33%
jan 1, 2014
410.0K
-230.0K
-35.94%
jan 1, 2015
640.0K
+230.0K
56.1%
Ranking of countries by current statistics by years