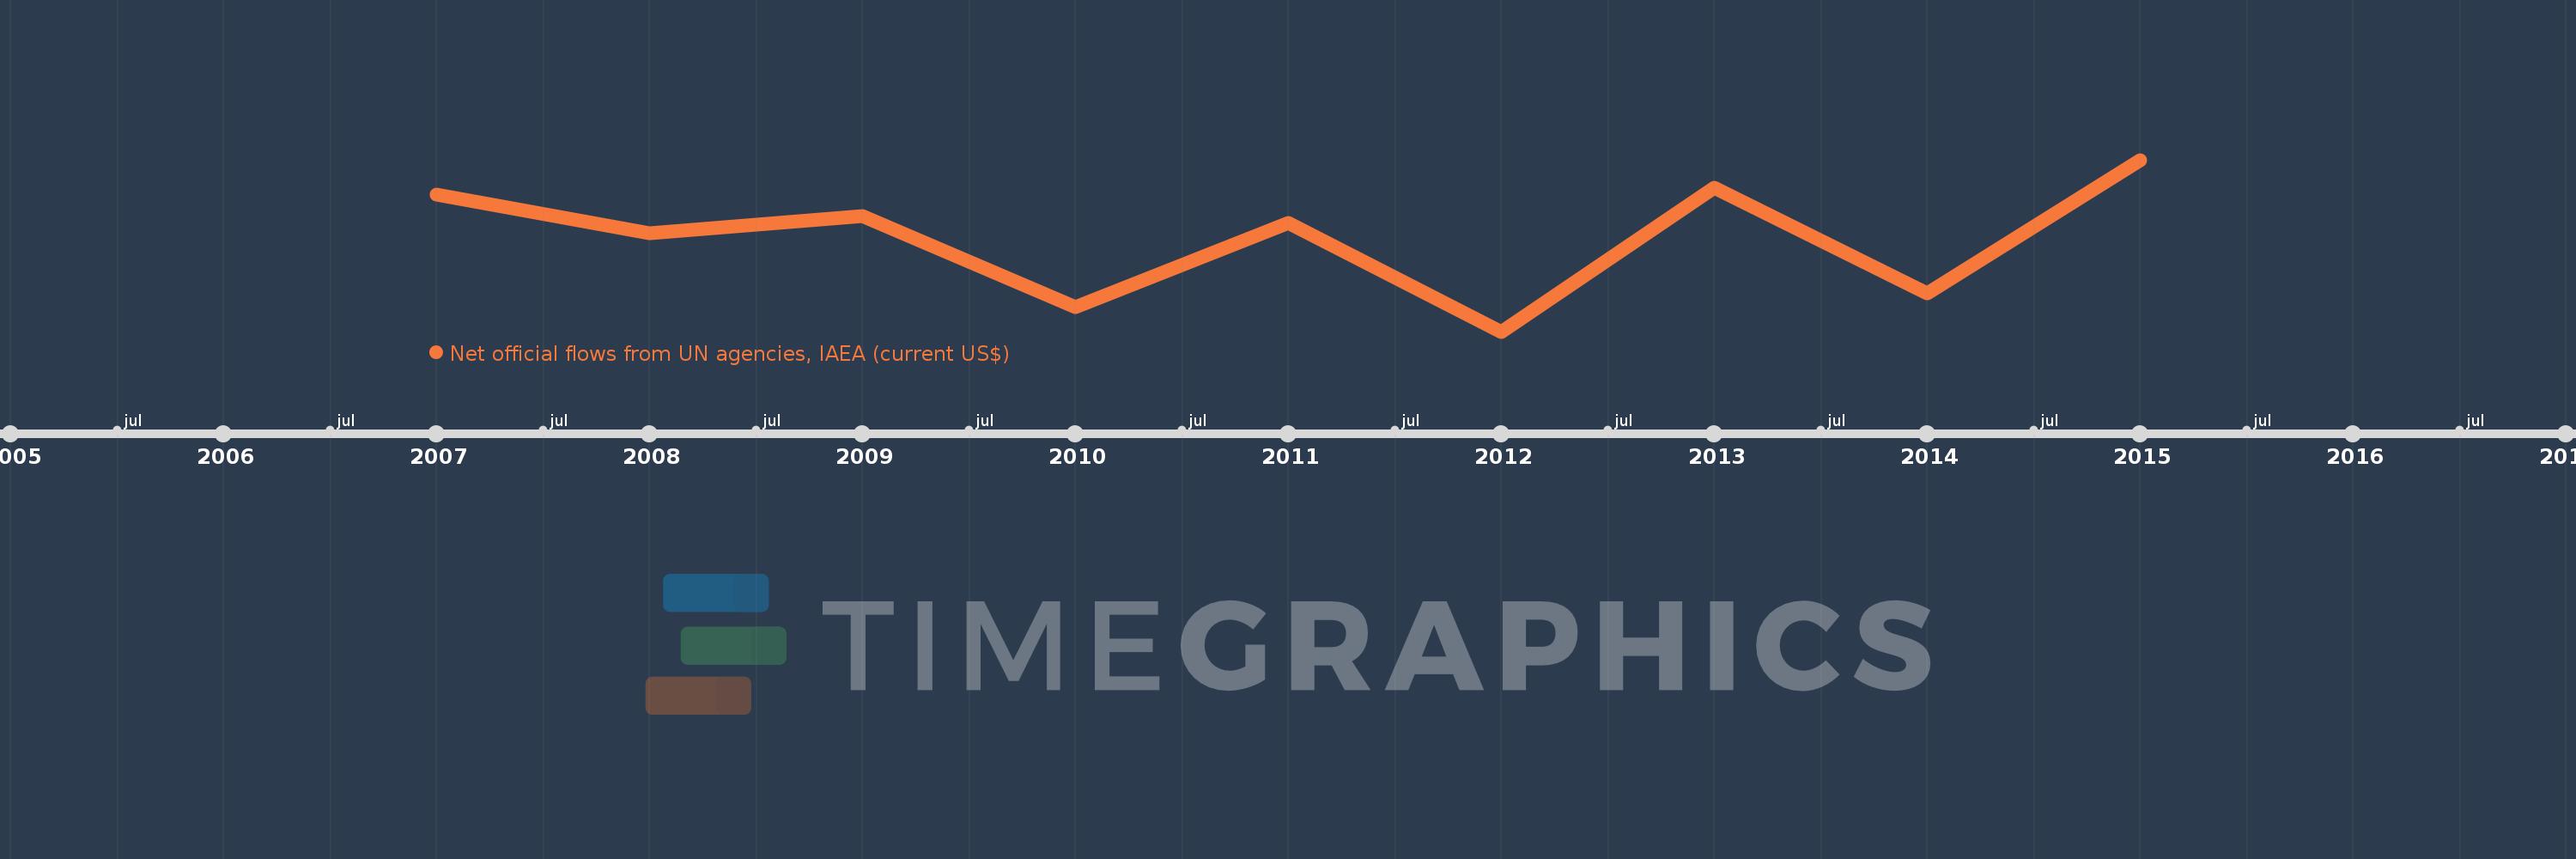
This timeline shows a graph from 2007 to 2015 of Mexico. No data until 2006. Number of actual observations by date: 9.
Source name:
World Development Indicators
Source organization:
Development Assistance Committee of the Organisation for Economic Co-operation and Development, Geographical Distribution of Financial Flows to Developing Countries, Development Co-operation Report, and International Development Statistics database. Data are available online at: www.oecd.org/dac/stats/idsonline.
Categories, topics:
Aid Effectiveness
Last updated:
apr 23, 2017
Indicators value changes by year
Meaning:
545.556K
Minimum:
280.0K
jan 1, 2012
Maximum:
770.0K
jan 1, 2015
At the date of observation
Value
Absolute change
Change from the previous value
jan 1, 2007
670.0K
+670.0K
0.0%
jan 1, 2008
560.0K
-110.0K
-16.42%
jan 1, 2009
610.0K
+50.0K
8.93%
jan 1, 2010
350.0K
-260.0K
-42.62%
jan 1, 2011
590.0K
+240.0K
68.57%
jan 1, 2012
280.0K
-310.0K
-52.54%
jan 1, 2013
690.0K
+410.0K
146.43%
jan 1, 2014
390.0K
-300.0K
-43.48%
jan 1, 2015
770.0K
+380.0K
97.44%
Ranking of countries by current statistics by years