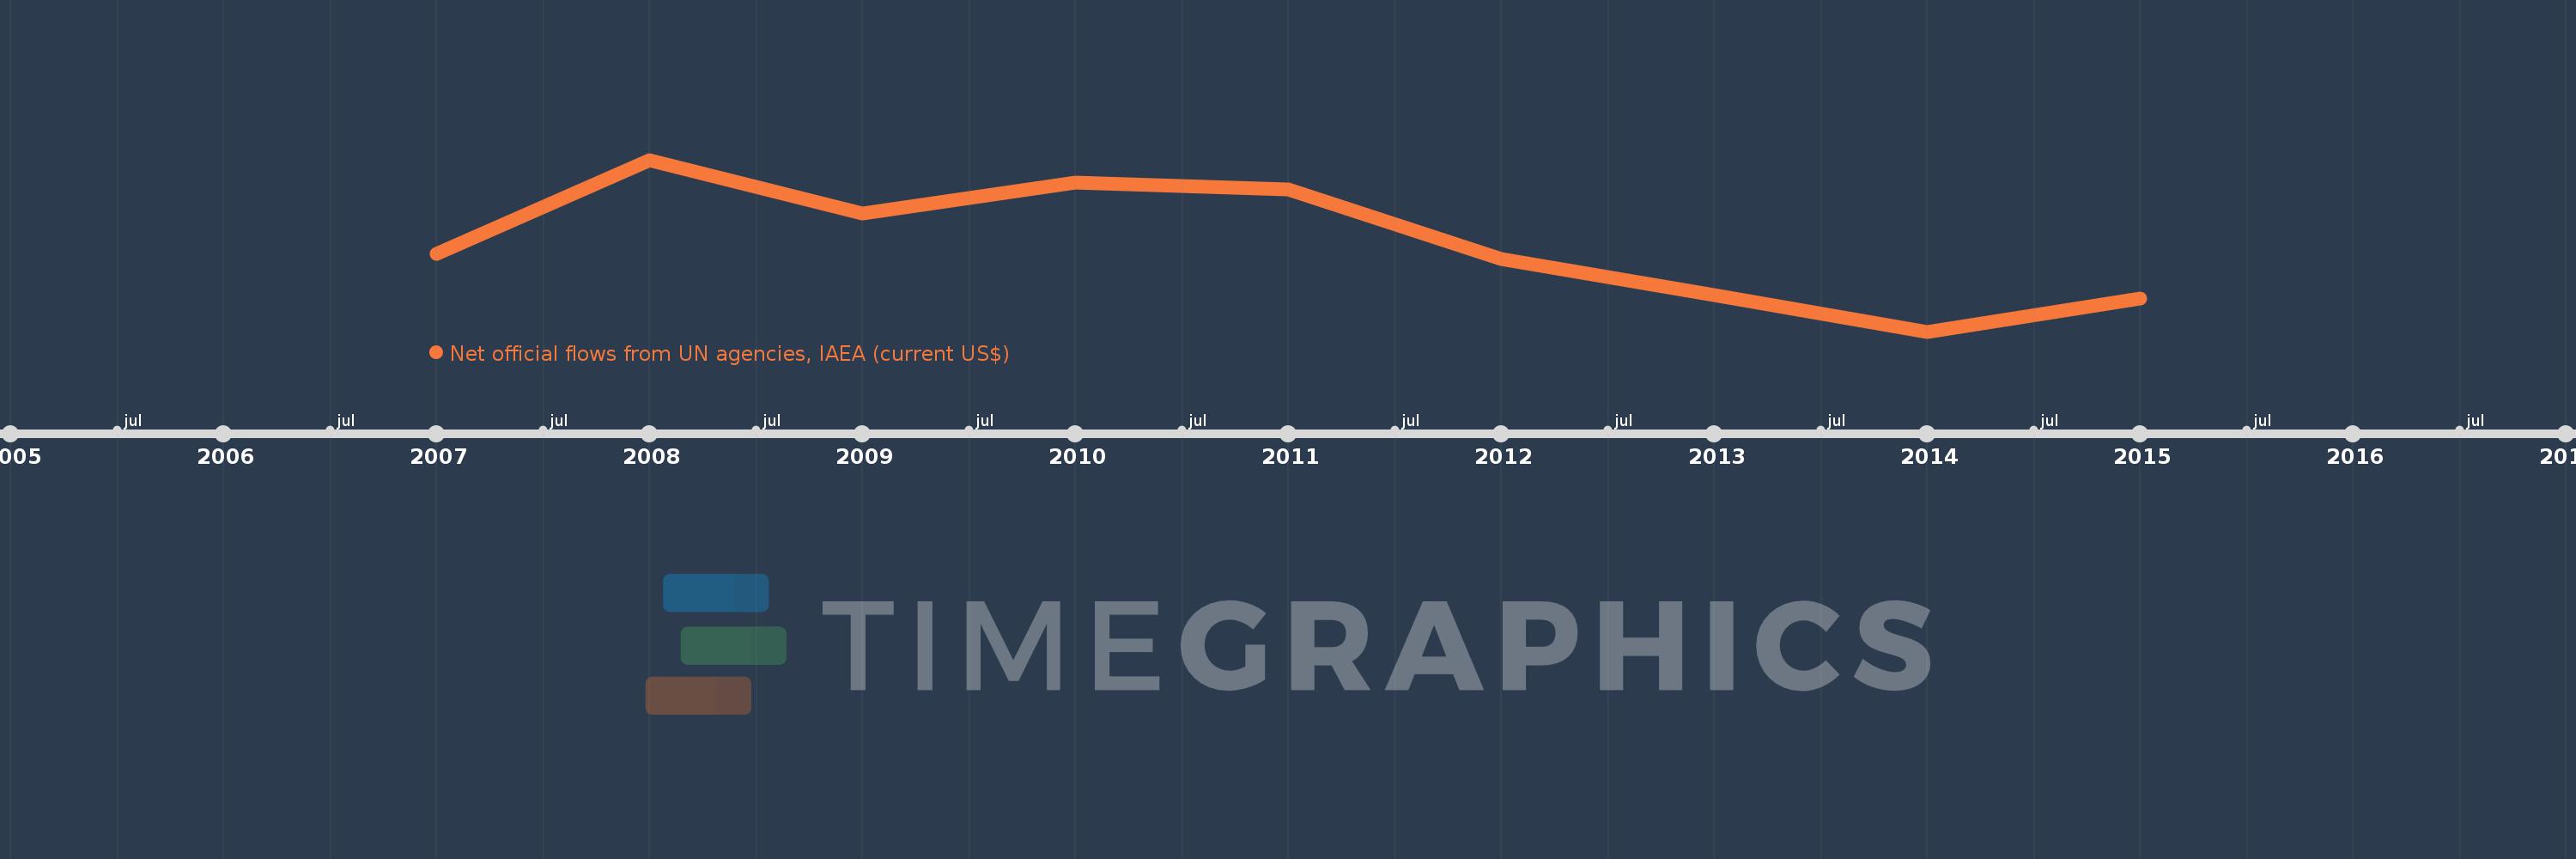
This timeline shows a graph from 2007 to 2015 of Syrian Arab Republic. No data until 2006. Number of actual observations by date: 9.
Source name:
World Development Indicators
Source organization:
Development Assistance Committee of the Organisation for Economic Co-operation and Development, Geographical Distribution of Financial Flows to Developing Countries, Development Co-operation Report, and International Development Statistics database. Data are available online at: www.oecd.org/dac/stats/idsonline.
Categories, topics:
Aid Effectiveness
Last updated:
apr 23, 2017
Indicators value changes by year
Meaning:
563.333K
Minimum:
50.0K
jan 1, 2014
Maximum:
1.04 mln
jan 1, 2008
At the date of observation
Value
Absolute change
Change from the previous value
jan 1, 2007
500.0K
+500.0K
0.0%
jan 1, 2008
1.04 mln
+540.0K
108.0%
jan 1, 2009
730.0K
-310.0K
-29.81%
jan 1, 2010
910.0K
+180.0K
24.66%
jan 1, 2011
870.0K
-40.0K
-4.4%
jan 1, 2012
470.0K
-400.0K
-45.98%
jan 1, 2013
260.0K
-210.0K
-44.68%
jan 1, 2014
50.0K
-210.0K
-80.77%
jan 1, 2015
240.0K
+190.0K
380.0%
Ranking of countries by current statistics by years