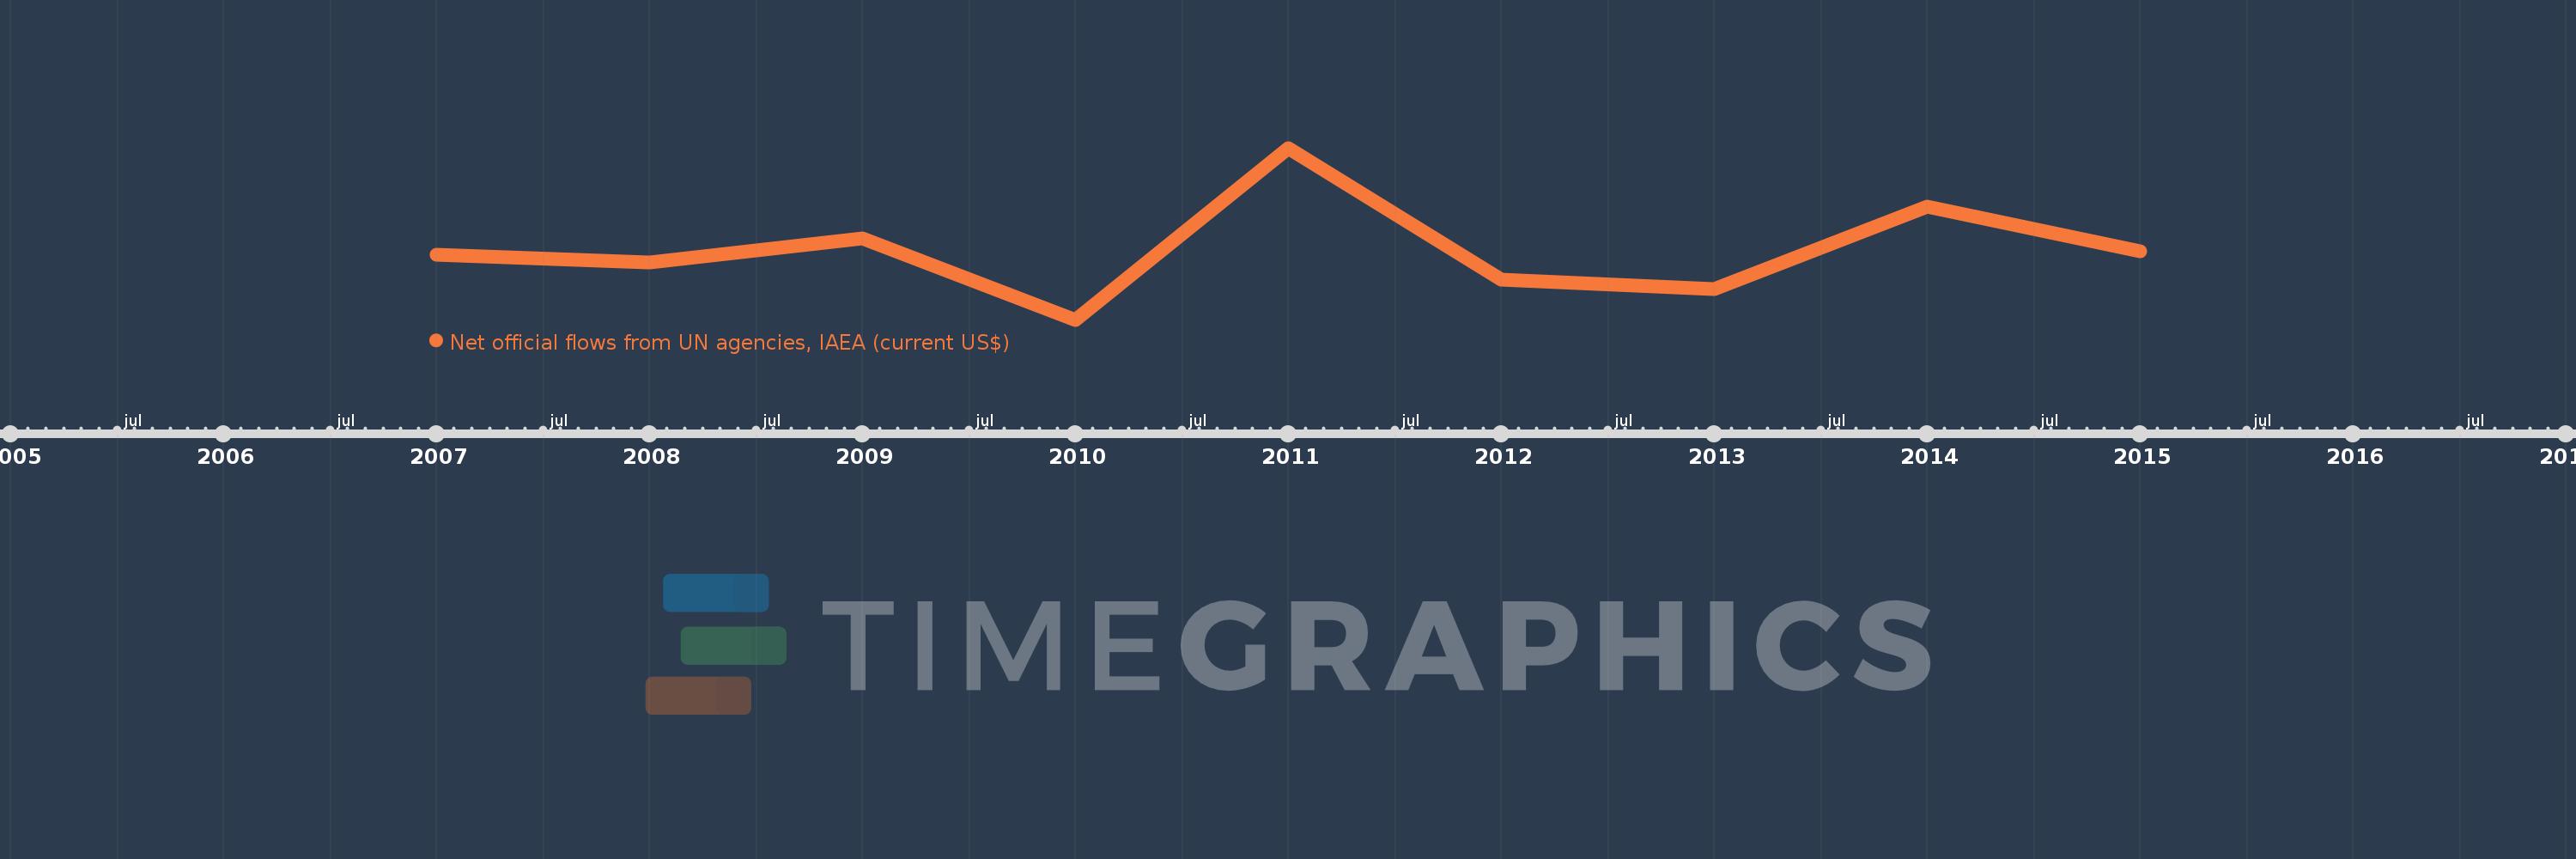
This timeline shows a graph from 2007 to 2015 of World. No data until 2006. Number of actual observations by date: 9.
Source name:
World Development Indicators
Source organization:
Development Assistance Committee of the Organisation for Economic Co-operation and Development, Geographical Distribution of Financial Flows to Developing Countries, Development Co-operation Report, and International Development Statistics database. Data are available online at: www.oecd.org/dac/stats/idsonline.
Categories, topics:
Aid Effectiveness
Last updated:
apr 23, 2017
Indicators value changes by year
Meaning:
74.184 mln
Minimum:
64.87 mln
jan 1, 2010
Maximum:
87.86 mln
jan 1, 2011
At the date of observation
Value
Absolute change
Change from the previous value
jan 1, 2007
73.53 mln
+73.53 mln
0.0%
jan 1, 2008
72.51 mln
-1.02 mln
-1.39%
jan 1, 2009
75.71 mln
+3.2 mln
4.41%
jan 1, 2010
64.87 mln
-10.84 mln
-14.32%
jan 1, 2011
87.86 mln
+22.99 mln
35.44%
jan 1, 2012
70.23 mln
-17.63 mln
-20.07%
jan 1, 2013
68.92 mln
-1.31 mln
-1.87%
jan 1, 2014
79.96 mln
+11.04 mln
16.02%
jan 1, 2015
74.07 mln
-5.89 mln
-7.37%
Ranking of countries by current statistics by years