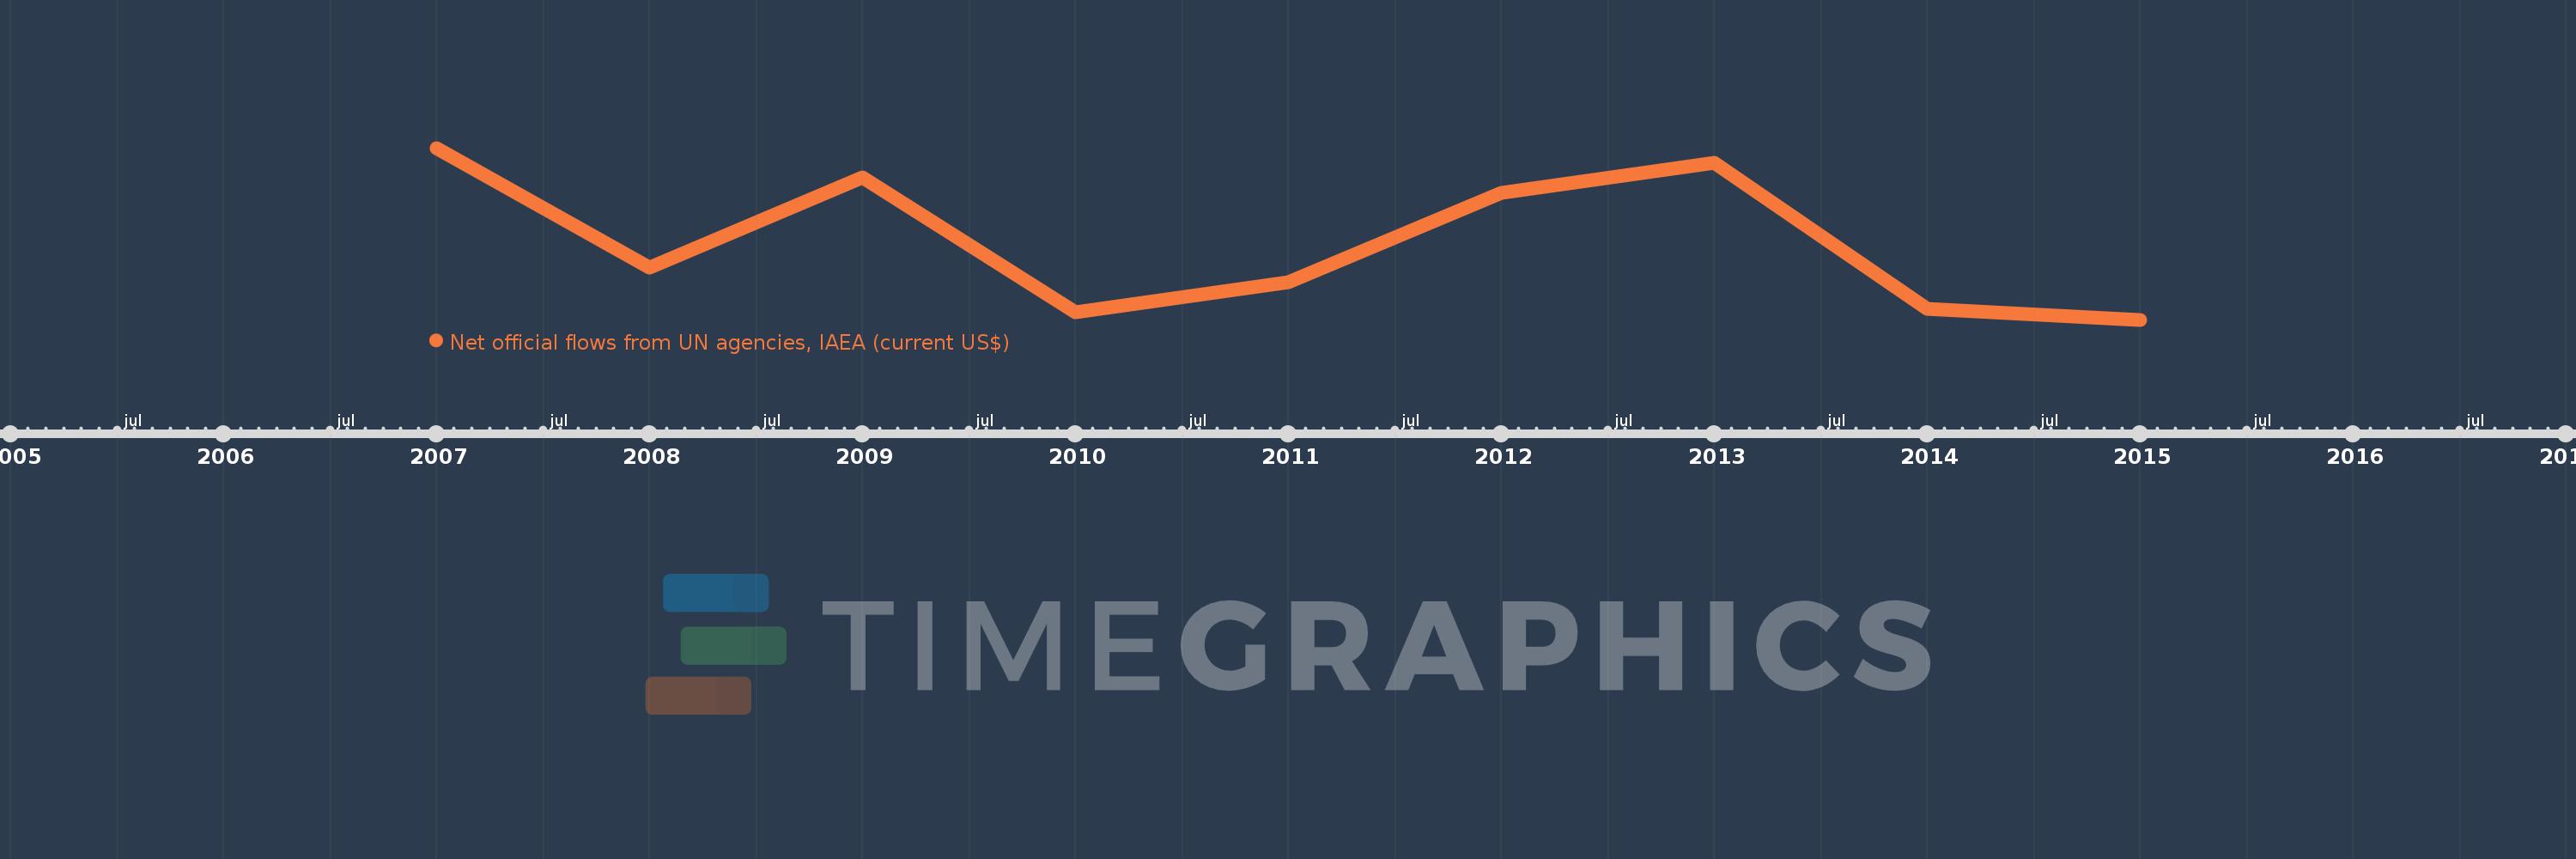
This timeline shows a graph from 2007 to 2015 of Bolivia. No data until 2006. Number of actual observations by date: 9.
Source name:
World Development Indicators
Source organization:
Development Assistance Committee of the Organisation for Economic Co-operation and Development, Geographical Distribution of Financial Flows to Developing Countries, Development Co-operation Report, and International Development Statistics database. Data are available online at: www.oecd.org/dac/stats/idsonline.
Categories, topics:
Aid Effectiveness
Last updated:
apr 23, 2017
Indicators value changes by year
Meaning:
280.0K
Minimum:
70.0K
jan 1, 2015
Maximum:
530.0K
jan 1, 2007
At the date of observation
Value
Absolute change
Change from the previous value
jan 1, 2007
530.0K
+530.0K
0.0%
jan 1, 2008
210.0K
-320.0K
-60.38%
jan 1, 2009
450.0K
+240.0K
114.29%
jan 1, 2010
90.0K
-360.0K
-80.0%
jan 1, 2011
170.0K
+80.0K
88.89%
jan 1, 2012
410.0K
+240.0K
141.18%
jan 1, 2013
490.0K
+80.0K
19.51%
jan 1, 2014
100.0K
-390.0K
-79.59%
jan 1, 2015
70.0K
-30.0K
-30.0%
Ranking of countries by current statistics by years