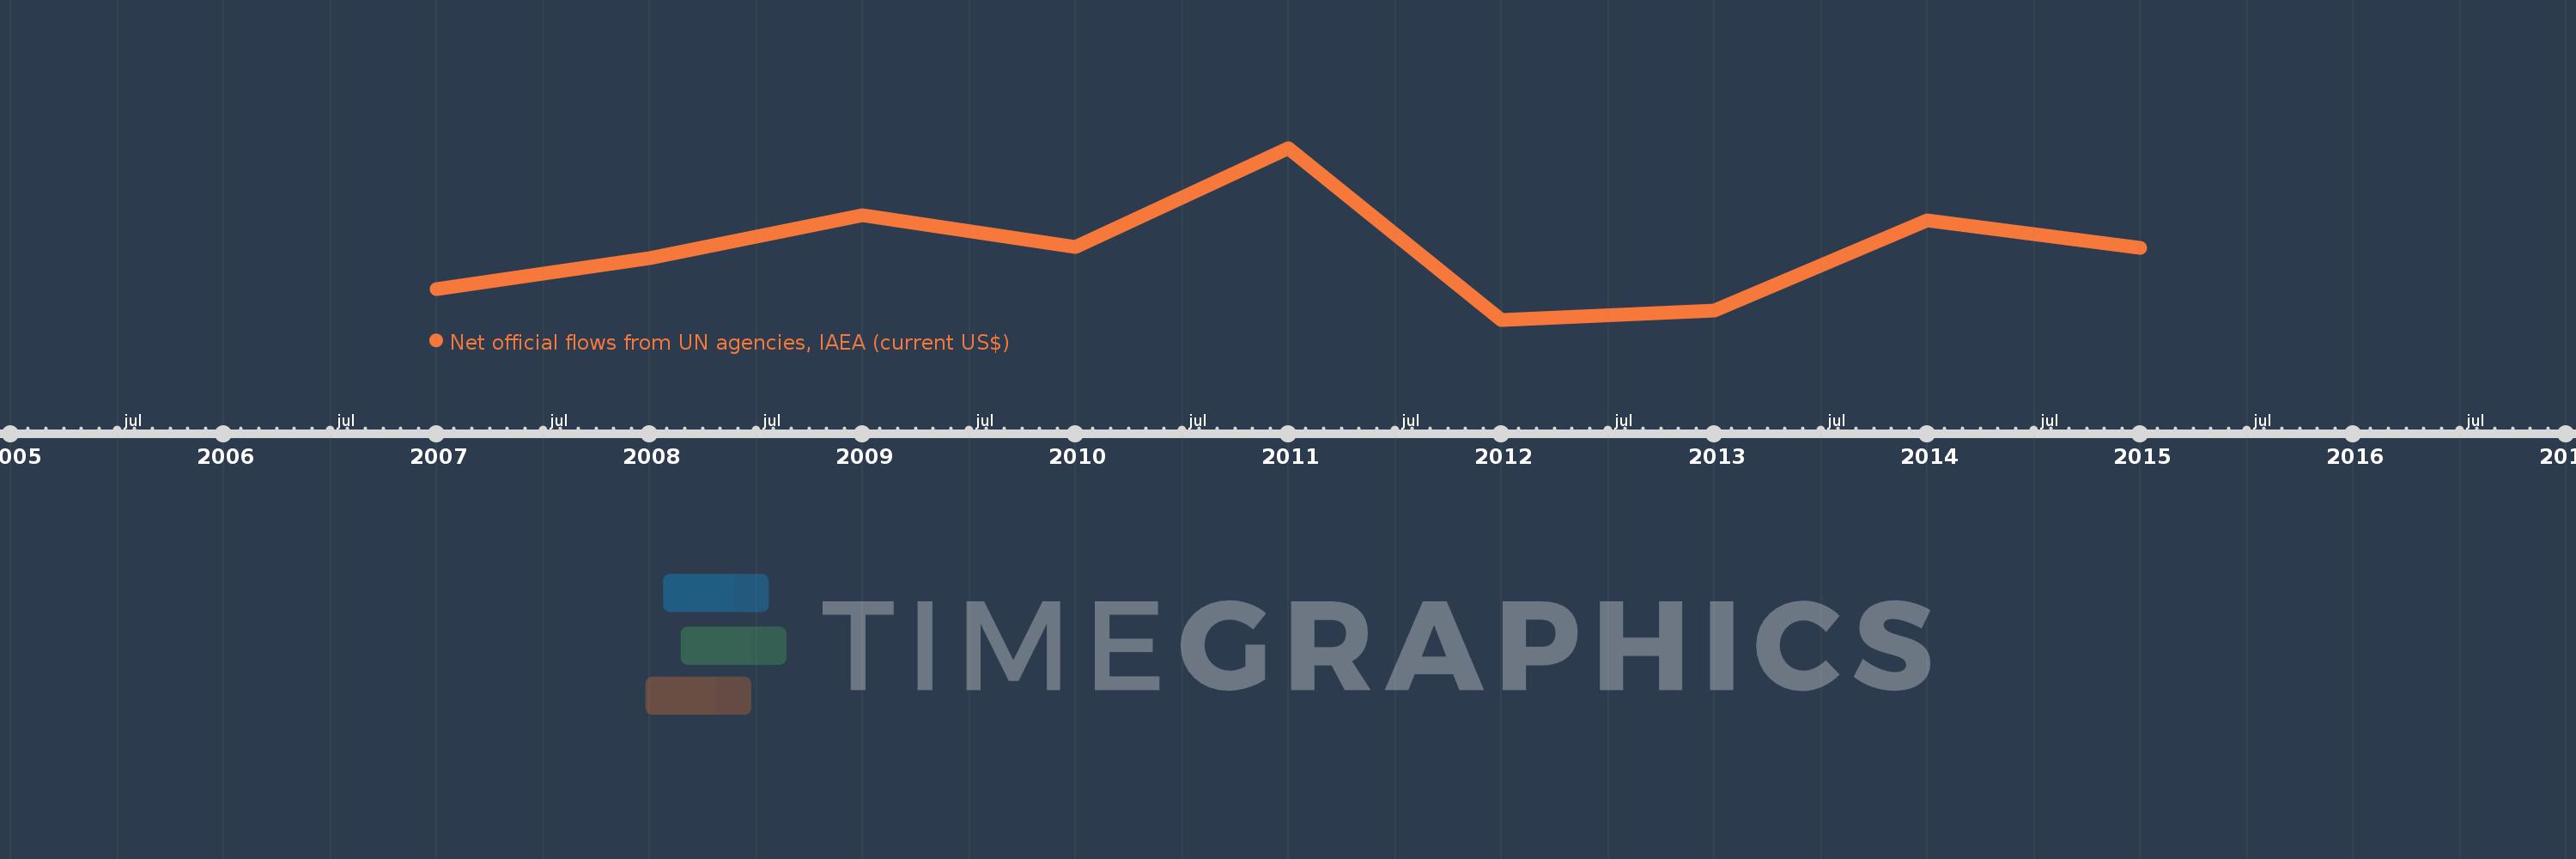
This timeline shows a graph from 2007 to 2015 of Heavily indebted poor countries (HIPC). No data until 2006. Number of actual observations by date: 9.
Source name:
World Development Indicators
Source organization:
Development Assistance Committee of the Organisation for Economic Co-operation and Development, Geographical Distribution of Financial Flows to Developing Countries, Development Co-operation Report, and International Development Statistics database. Data are available online at: www.oecd.org/dac/stats/idsonline.
Categories, topics:
Aid Effectiveness
Last updated:
apr 23, 2017
Indicators value changes by year
Meaning:
9.71 mln
Minimum:
7.81 mln
jan 1, 2012
Maximum:
12.53 mln
jan 1, 2011
At the date of observation
Value
Absolute change
Change from the previous value
jan 1, 2007
8.66 mln
+8.66 mln
0.0%
jan 1, 2008
9.51 mln
+850.0K
9.82%
jan 1, 2009
10.69 mln
+1.18 mln
12.41%
jan 1, 2010
9.8 mln
-890.0K
-8.33%
jan 1, 2011
12.53 mln
+2.73 mln
27.86%
jan 1, 2012
7.81 mln
-4.72 mln
-37.67%
jan 1, 2013
8.07 mln
+260.0K
3.33%
jan 1, 2014
10.54 mln
+2.47 mln
30.61%
jan 1, 2015
9.78 mln
-760.0K
-7.21%
Ranking of countries by current statistics by years