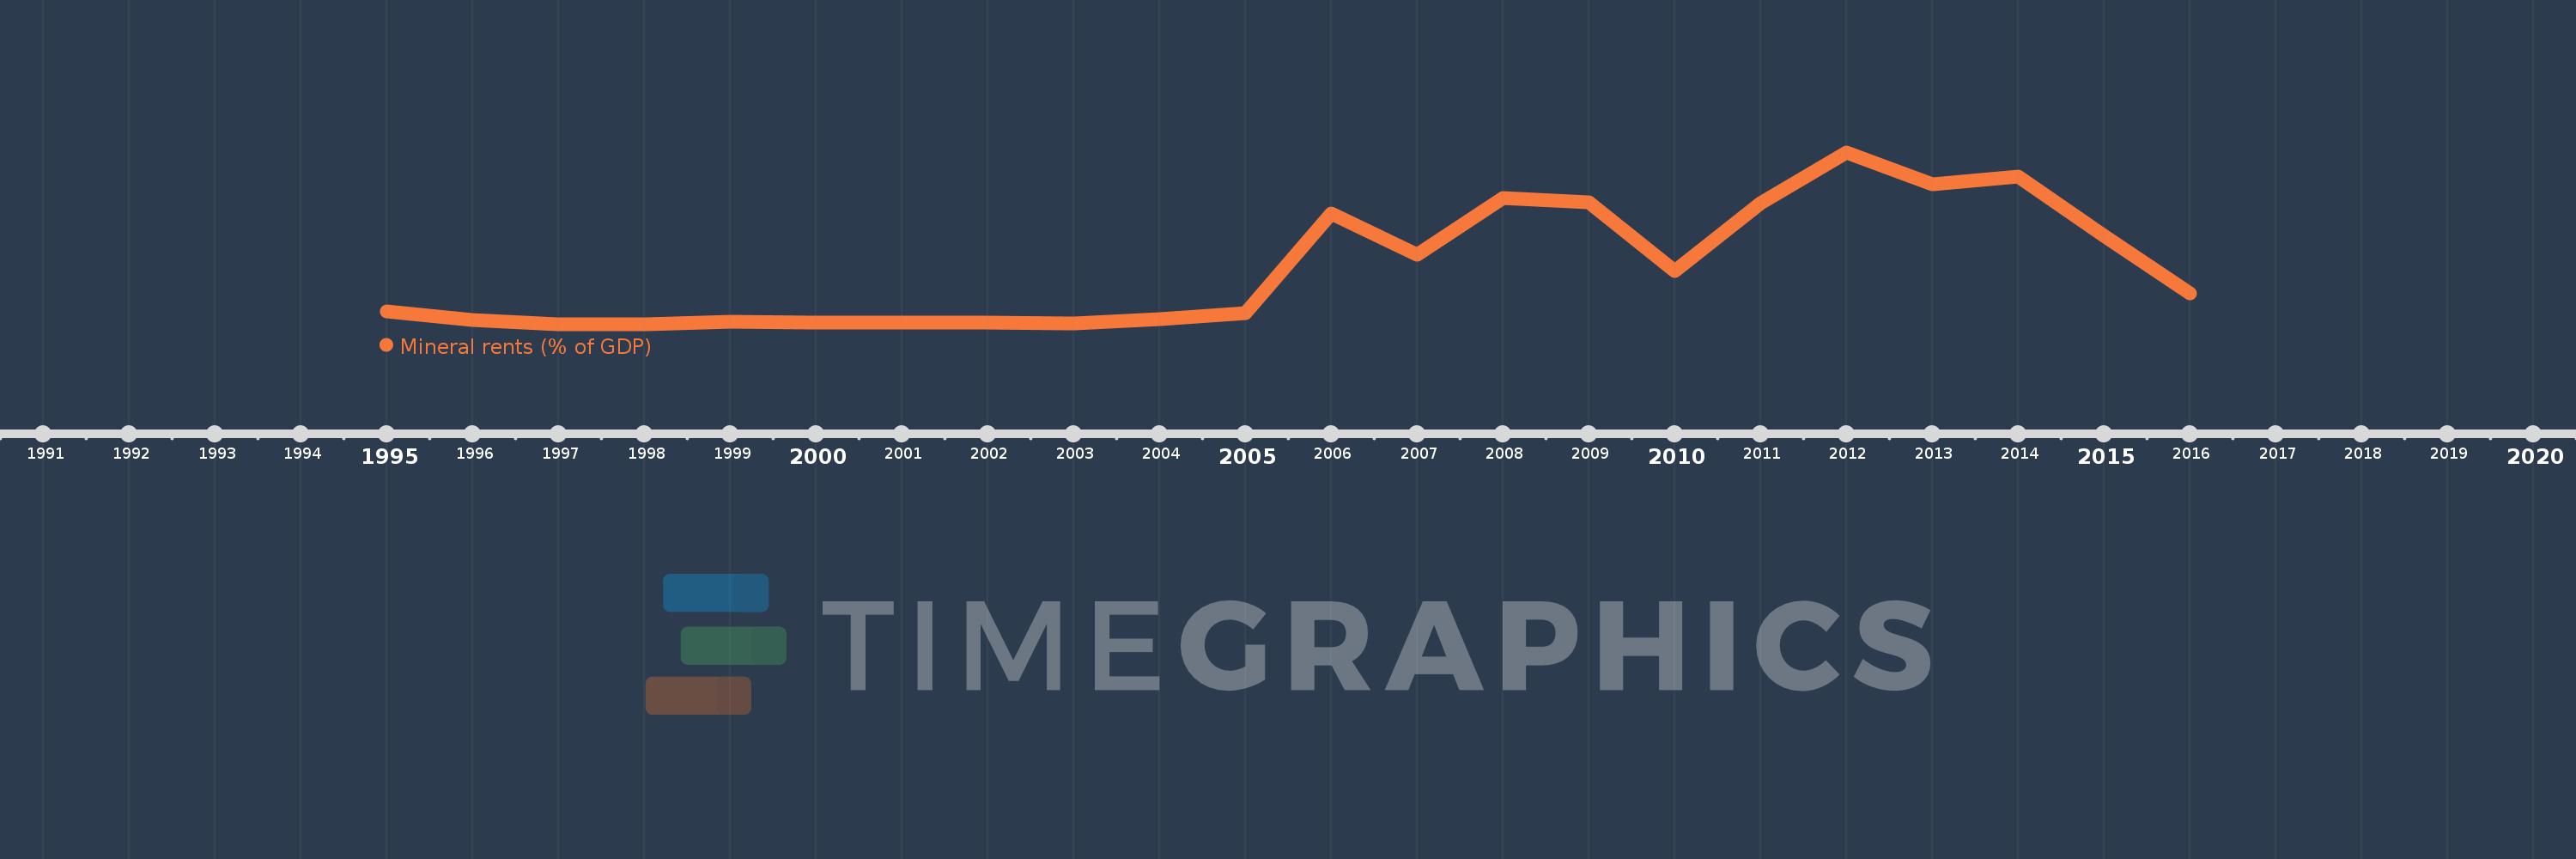
This timeline shows a graph from 1995 to 2016 of Bosnia and Herzegovina. No data until 1994. Number of actual observations by date: 22.
Source name:
World Development Indicators
Source organization:
Estimates based on sources and methods described in "The Changing Wealth of Nations: Measuring Sustainable Development in the New Millennium" (World Bank, 2011).
Categories, topics:
Energy & Mining, Environment
Last updated:
apr 23, 2017
Indicators value changes by year
Meaning:
0.43
Minimum:
0.0
jan 1, 1997
Maximum:
1.328
jan 1, 2012
At the date of observation
Value
Absolute change
Change from the previous value
jan 1, 1995
0.098
+0.098
0.0%
jan 1, 1996
0.034
-0.064
-65.05%
jan 1, 1997
0.0
-0.034
-100.0%
jan 1, 1998
0.002
+0.002
%
jan 1, 1999
0.019
+0.017
820.0%
jan 1, 2000
0.014
-0.005
-25.7%
jan 1, 2001
0.014
0.0
-0.7%
jan 1, 2002
0.013
0.0
-3.5%
jan 1, 2003
0.008
-0.005
-37.93%
jan 1, 2004
0.038
+0.03
367.91%
jan 1, 2005
0.084
+0.046
119.5%
jan 1, 2006
0.857
+0.773
920.42%
jan 1, 2007
0.539
-0.319
-37.18%
jan 1, 2008
0.978
+0.44
81.6%
jan 1, 2009
0.945
-0.033
-3.38%
jan 1, 2010
0.41
-0.535
-56.62%
jan 1, 2011
0.937
+0.527
128.64%
jan 1, 2012
1.328
+0.391
41.74%
jan 1, 2013
1.082
-0.246
-18.52%
jan 1, 2014
1.14
+0.058
5.32%
jan 1, 2015
0.685
-0.455
-39.88%
jan 1, 2016
0.241
-0.445
-64.88%
Ranking of countries by current statistics by years