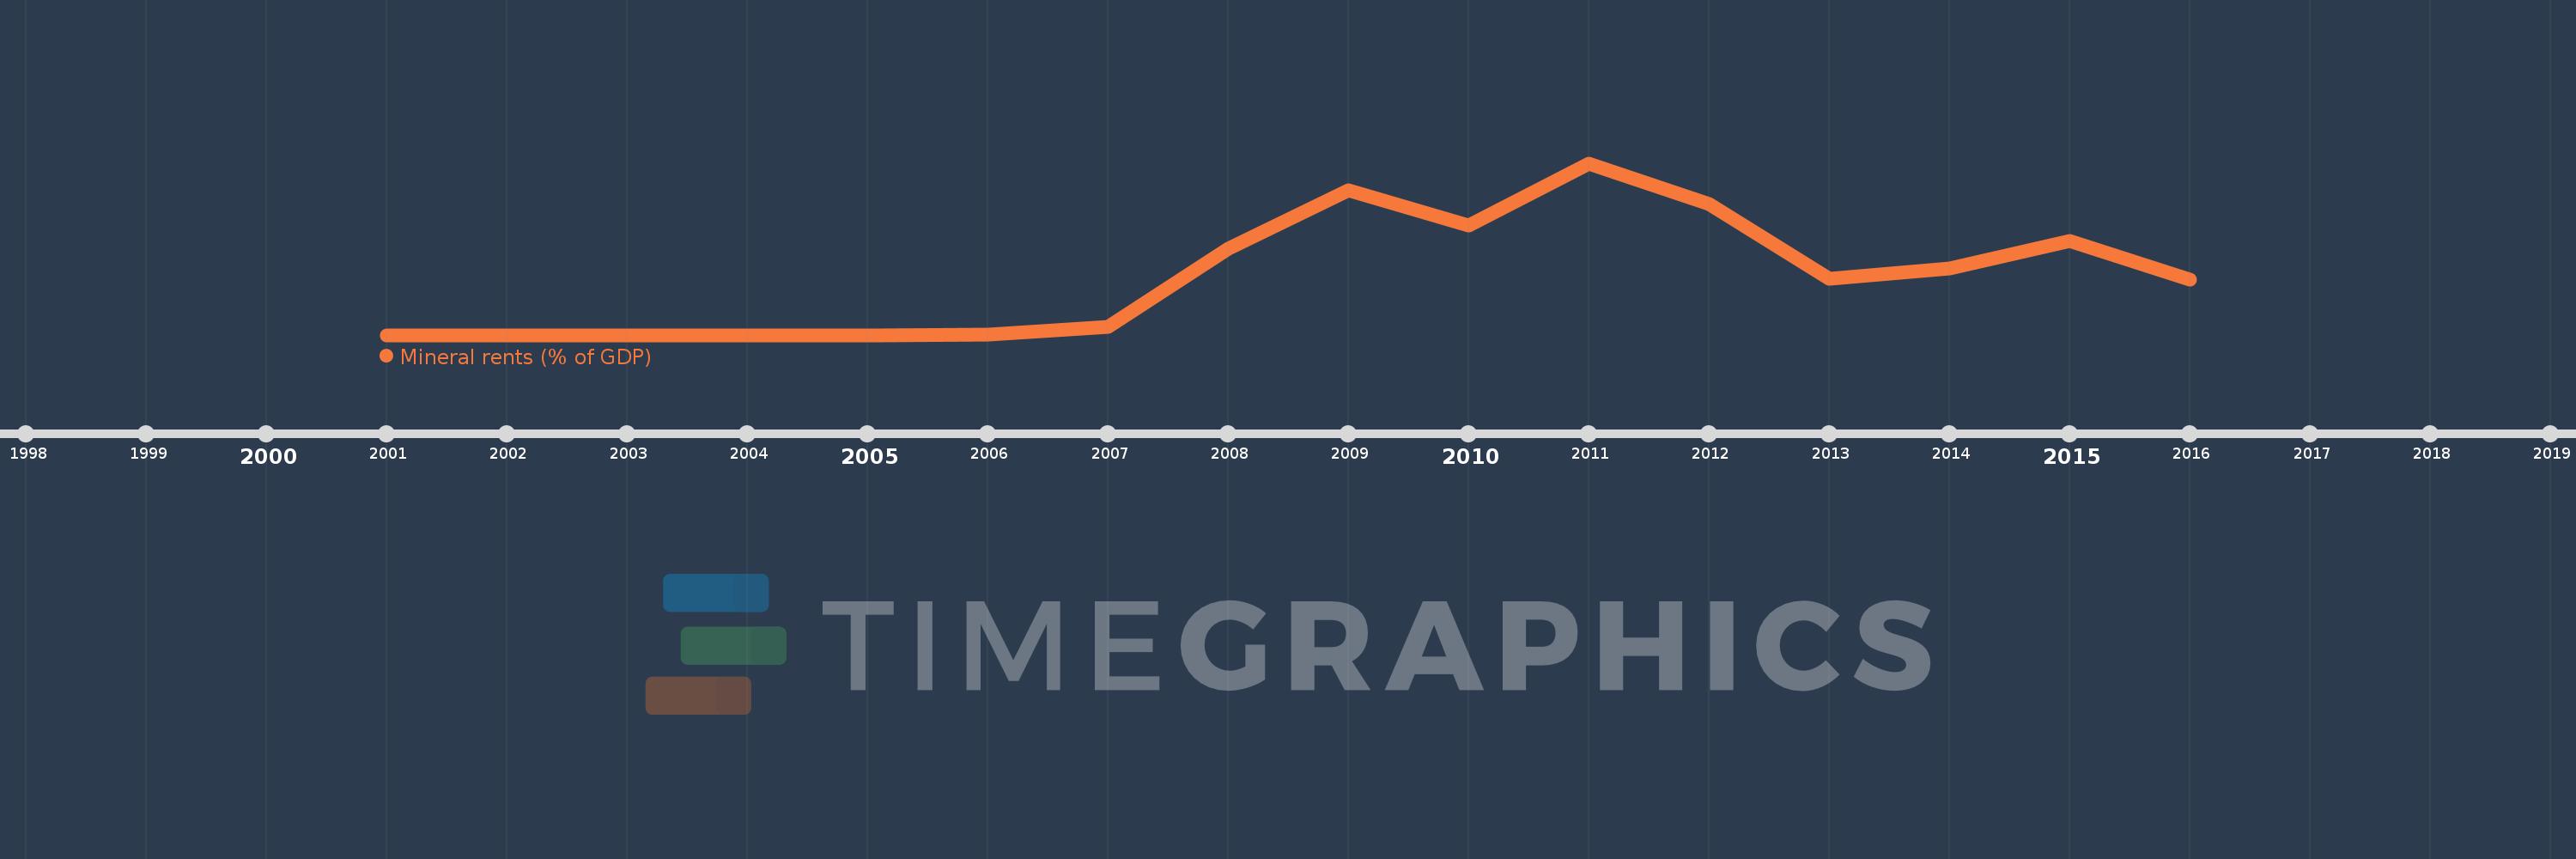
This timeline shows a graph from 2001 to 2016 of Kosovo. No data until 2000. Number of actual observations by date: 16.
Source name:
World Development Indicators
Source organization:
Estimates based on sources and methods described in "The Changing Wealth of Nations: Measuring Sustainable Development in the New Millennium" (World Bank, 2011).
Categories, topics:
Energy & Mining, Environment
Last updated:
apr 23, 2017
Indicators value changes by year
Meaning:
0.829
Minimum:
0.0
jan 1, 2001
Maximum:
2.467
jan 1, 2011
At the date of observation
Value
Absolute change
Change from the previous value
jan 1, 2001
0.0
0.0
0.0%
jan 1, 2002
0.0
0.0
%
jan 1, 2003
0.0
0.0
%
jan 1, 2004
0.0
0.0
%
jan 1, 2005
0.0
0.0
%
jan 1, 2006
0.003
+0.003
%
jan 1, 2007
0.116
+0.113
3.85K%
jan 1, 2008
1.243
+1.127
971.66%
jan 1, 2009
2.083
+0.84
67.62%
jan 1, 2010
1.571
-0.512
-24.59%
jan 1, 2011
2.467
+0.896
57.06%
jan 1, 2012
1.878
-0.589
-23.88%
jan 1, 2013
0.806
-1.072
-57.1%
jan 1, 2014
0.953
+0.148
18.32%
jan 1, 2015
1.352
+0.399
41.88%
jan 1, 2016
0.796
-0.556
-41.14%
Ranking of countries by current statistics by years