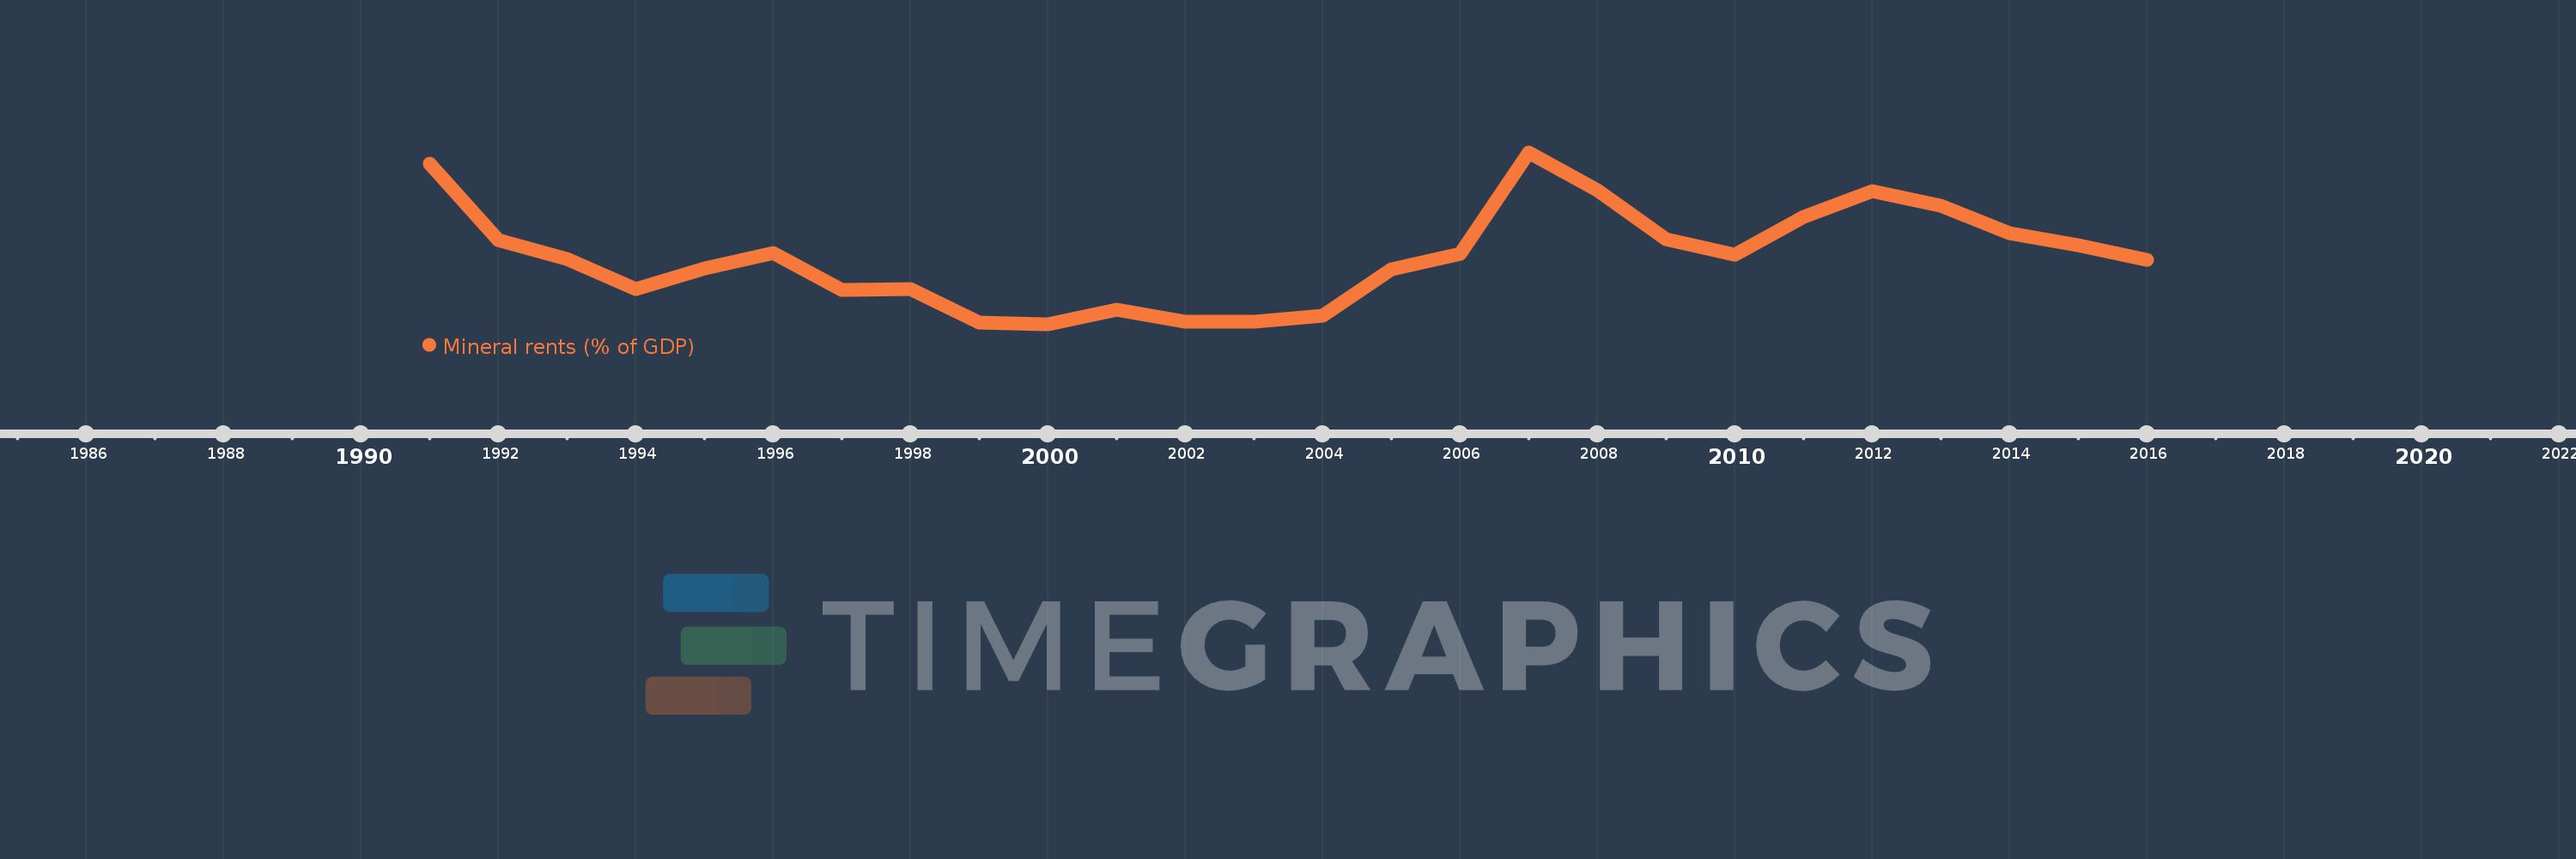
This timeline shows a graph from 1991 to 2016 of Poland. No data until 1990. Number of actual observations by date: 26.
Source name:
World Development Indicators
Source organization:
Estimates based on sources and methods described in "The Changing Wealth of Nations: Measuring Sustainable Development in the New Millennium" (World Bank, 2011).
Categories, topics:
Energy & Mining, Environment
Last updated:
apr 23, 2017
Indicators value changes by year
Meaning:
0.375
Minimum:
0.072
jan 1, 2000
Maximum:
0.846
jan 1, 2007
At the date of observation
Value
Absolute change
Change from the previous value
jan 1, 1991
0.797
+0.797
0.0%
jan 1, 1992
0.451
-0.345
-43.35%
jan 1, 1993
0.366
-0.085
-18.85%
jan 1, 1994
0.23
-0.136
-37.22%
jan 1, 1995
0.324
+0.094
40.78%
jan 1, 1996
0.391
+0.067
20.8%
jan 1, 1997
0.226
-0.165
-42.27%
jan 1, 1998
0.232
+0.007
2.88%
jan 1, 1999
0.08
-0.152
-65.43%
jan 1, 2000
0.072
-0.008
-9.77%
jan 1, 2001
0.138
+0.066
90.64%
jan 1, 2002
0.084
-0.055
-39.47%
jan 1, 2003
0.084
+0.001
0.68%
jan 1, 2004
0.111
+0.027
32.24%
jan 1, 2005
0.318
+0.206
185.35%
jan 1, 2006
0.388
+0.07
22.12%
jan 1, 2007
0.846
+0.458
118.07%
jan 1, 2008
0.675
-0.171
-20.23%
jan 1, 2009
0.455
-0.22
-32.64%
jan 1, 2010
0.384
-0.071
-15.62%
jan 1, 2011
0.556
+0.172
44.93%
jan 1, 2012
0.671
+0.115
20.63%
jan 1, 2013
0.605
-0.066
-9.82%
jan 1, 2014
0.482
-0.123
-20.28%
jan 1, 2015
0.426
-0.056
-11.71%
jan 1, 2016
0.362
-0.063
-14.9%
Ranking of countries by current statistics by years