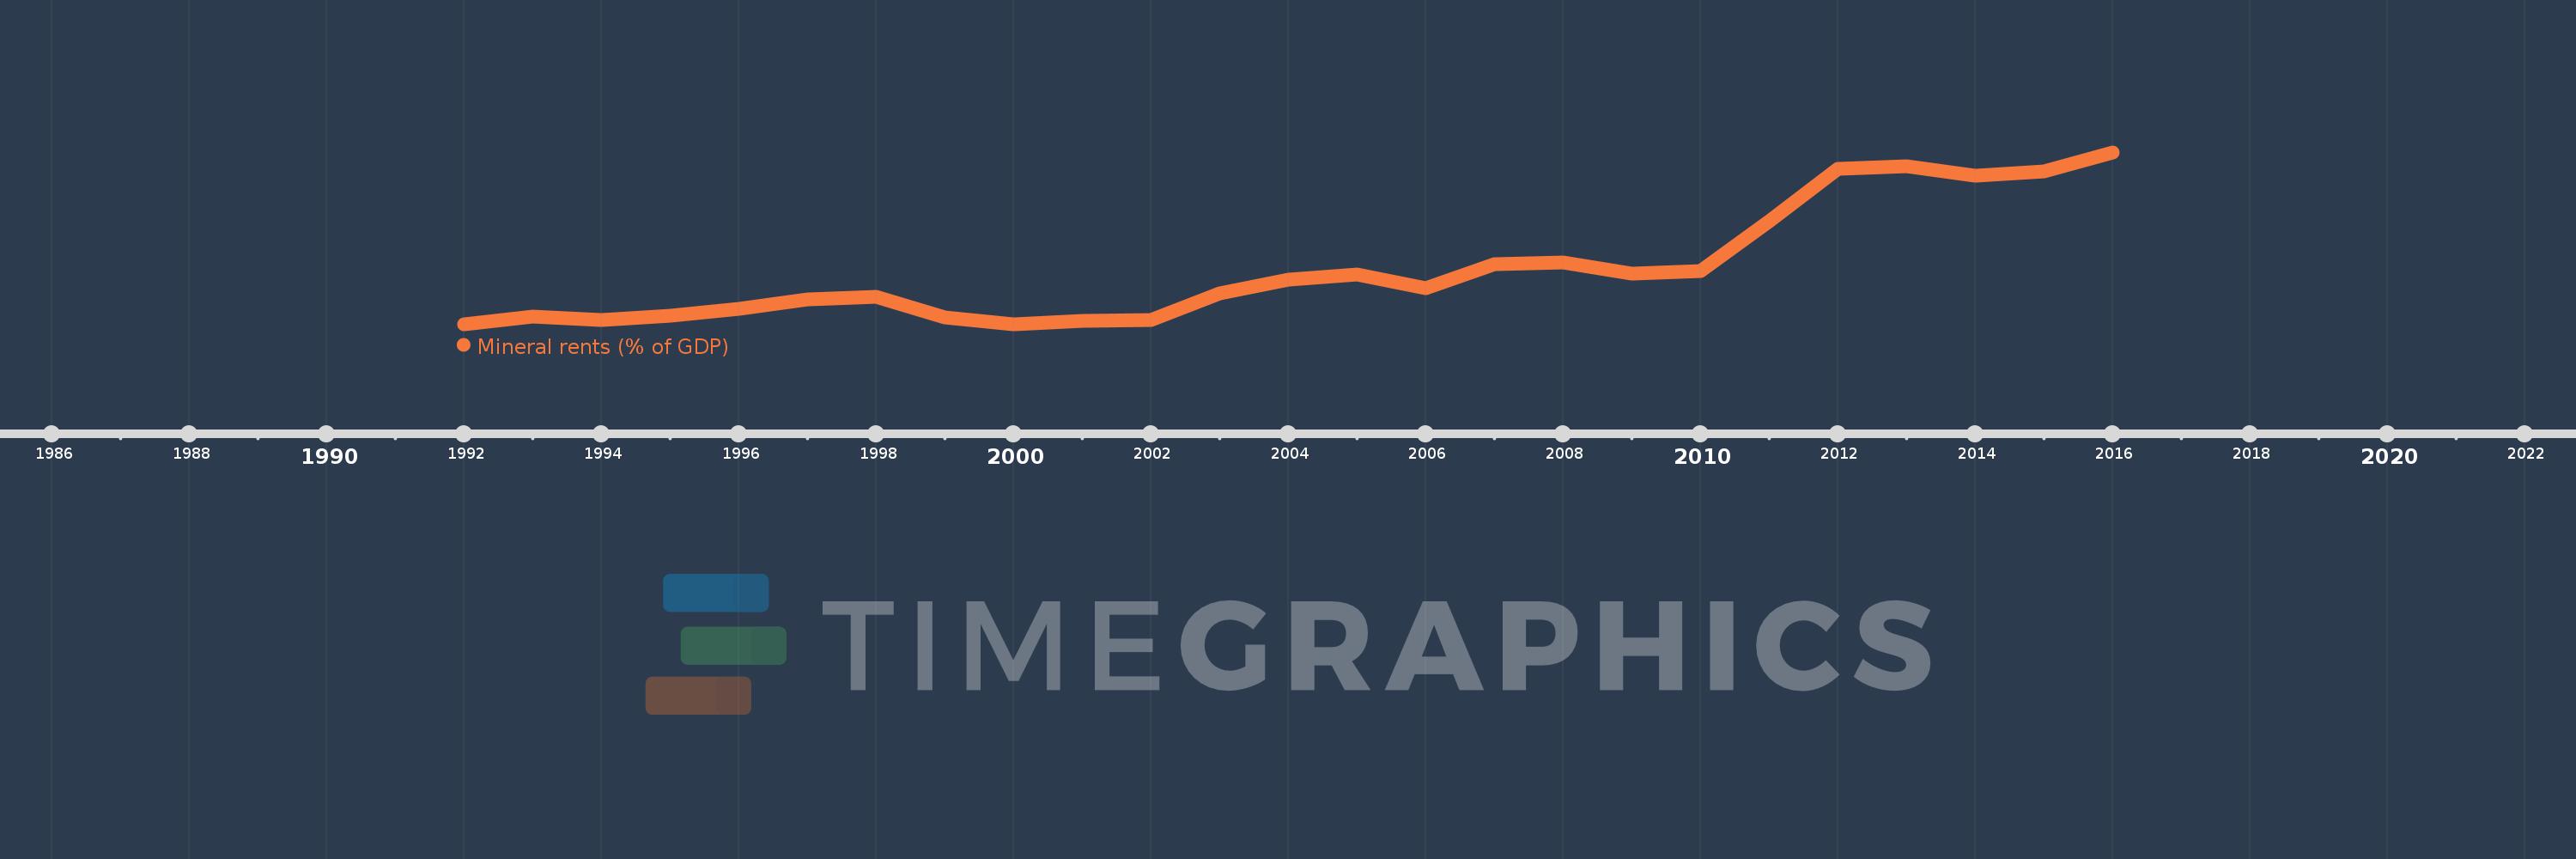
This timeline shows a graph from 1992 to 2016 of Tajikistan. No data until 1991. Number of actual observations by date: 25.
Source name:
World Development Indicators
Source organization:
Estimates based on sources and methods described in "The Changing Wealth of Nations: Measuring Sustainable Development in the New Millennium" (World Bank, 2011).
Categories, topics:
Energy & Mining, Environment
Last updated:
apr 23, 2017
Indicators value changes by year
Meaning:
0.605
Minimum:
0.0
jan 1, 1992
Maximum:
1.885
jan 1, 2016
At the date of observation
Value
Absolute change
Change from the previous value
jan 1, 1992
0.0
0.0
0.0%
jan 1, 1993
0.082
+0.082
%
jan 1, 1994
0.048
-0.034
-41.72%
jan 1, 1995
0.09
+0.042
89.29%
jan 1, 1996
0.173
+0.083
92.43%
jan 1, 1997
0.269
+0.095
55.08%
jan 1, 1998
0.302
+0.034
12.58%
jan 1, 1999
0.07
-0.233
-76.9%
jan 1, 2000
0.0
-0.07
-100.0%
jan 1, 2001
0.035
+0.035
%
jan 1, 2002
0.046
+0.011
31.99%
jan 1, 2003
0.34
+0.294
636.48%
jan 1, 2004
0.49
+0.15
44.08%
jan 1, 2005
0.545
+0.055
11.24%
jan 1, 2006
0.392
-0.154
-28.18%
jan 1, 2007
0.658
+0.267
68.12%
jan 1, 2008
0.675
+0.017
2.52%
jan 1, 2009
0.559
-0.116
-17.21%
jan 1, 2010
0.579
+0.02
3.57%
jan 1, 2011
1.13
+0.552
95.35%
jan 1, 2012
1.705
+0.574
50.79%
jan 1, 2013
1.731
+0.026
1.53%
jan 1, 2014
1.632
-0.098
-5.67%
jan 1, 2015
1.679
+0.046
2.84%
jan 1, 2016
1.885
+0.206
12.28%
Ranking of countries by current statistics by years