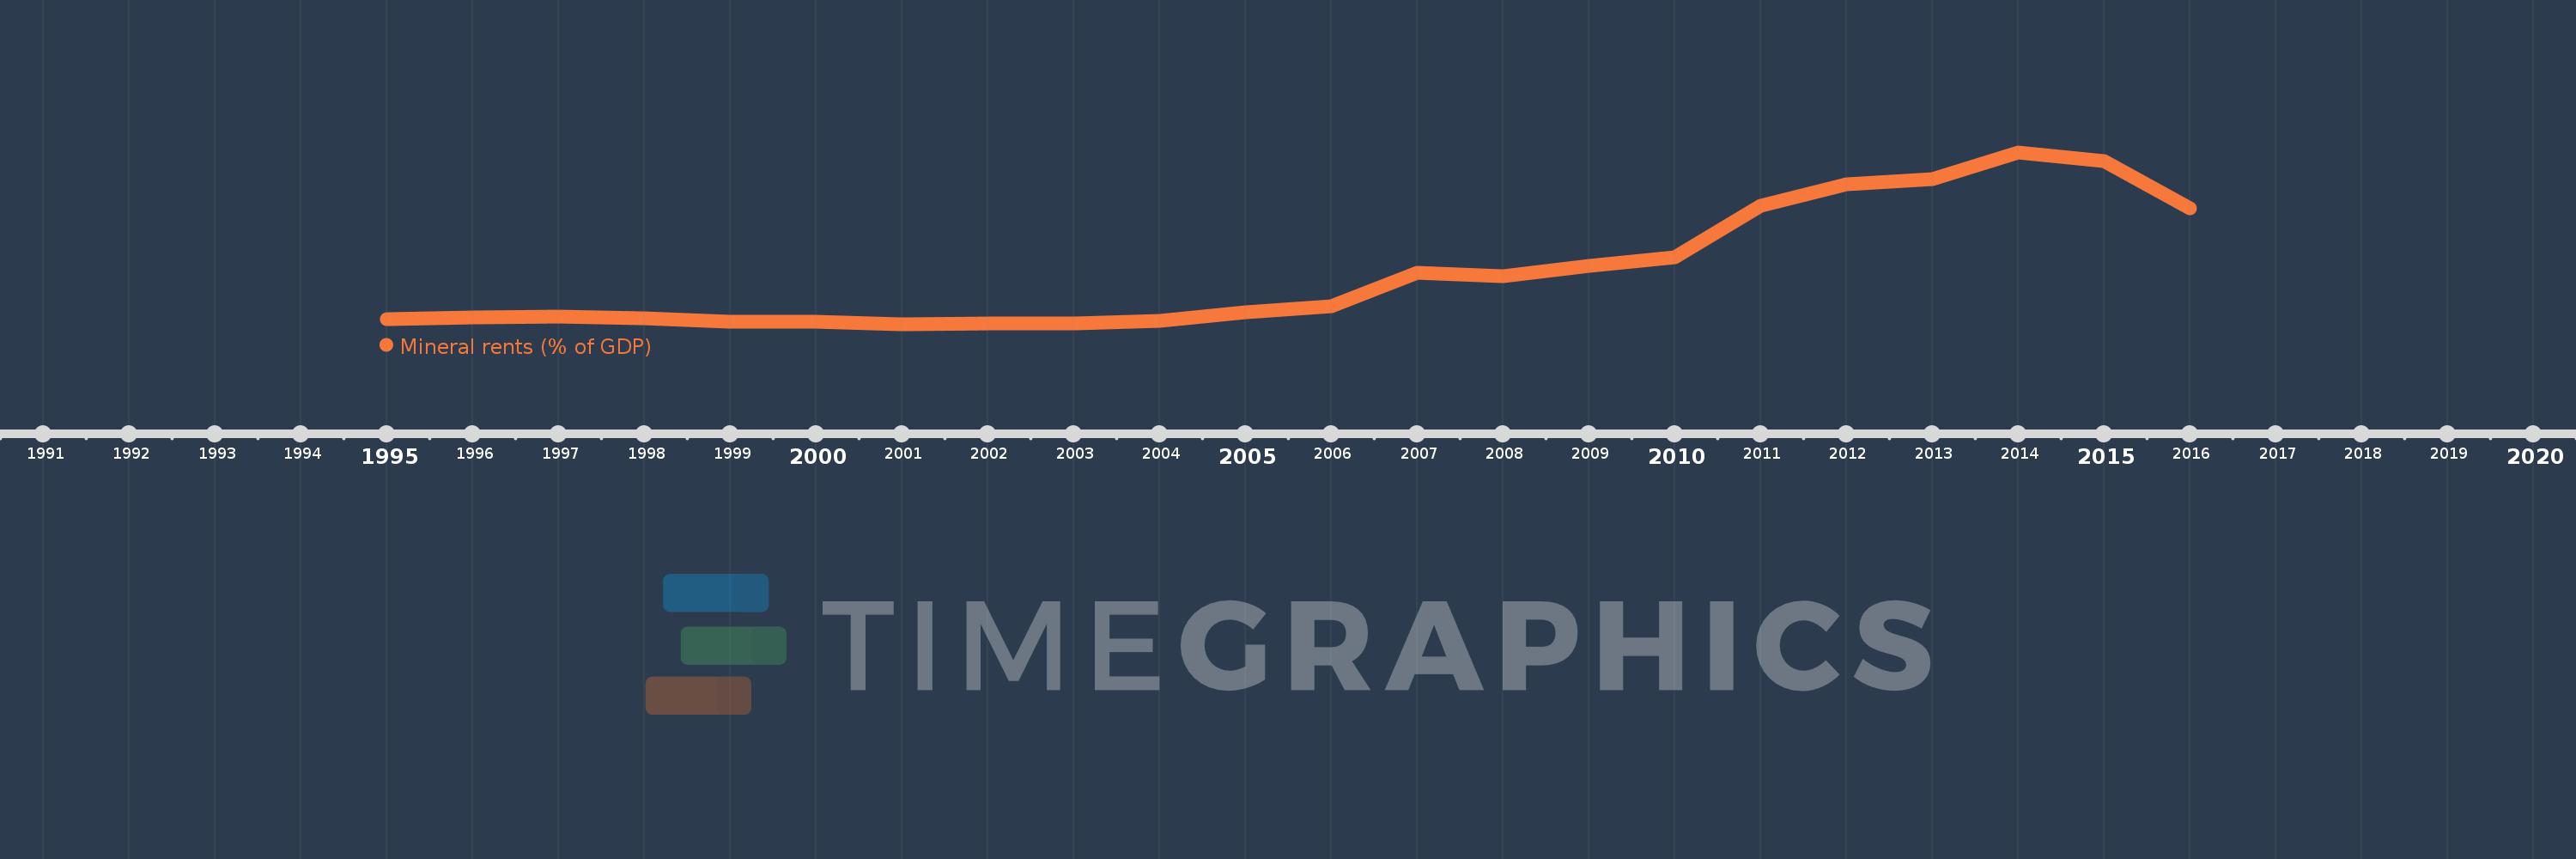
This timeline shows a graph from 1995 to 2016 of Congo, Dem. Rep.. No data until 1994. Number of actual observations by date: 22.
Source name:
World Development Indicators
Source organization:
Estimates based on sources and methods described in "The Changing Wealth of Nations: Measuring Sustainable Development in the New Millennium" (World Bank, 2011).
Categories, topics:
Energy & Mining, Environment
Last updated:
apr 23, 2017
Indicators value changes by year
Meaning:
6.539
Minimum:
0.091
jan 1, 2001
Maximum:
21.418
jan 1, 2014
At the date of observation
Value
Absolute change
Change from the previous value
jan 1, 1995
0.682
+0.682
0.0%
jan 1, 1996
0.948
+0.266
39.04%
jan 1, 1997
1.039
+0.091
9.59%
jan 1, 1998
0.795
-0.244
-23.49%
jan 1, 1999
0.359
-0.436
-54.84%
jan 1, 2000
0.392
+0.033
9.26%
jan 1, 2001
0.091
-0.301
-76.7%
jan 1, 2002
0.178
+0.087
94.87%
jan 1, 2003
0.207
+0.029
16.55%
jan 1, 2004
0.47
+0.263
126.75%
jan 1, 2005
1.571
+1.101
234.11%
jan 1, 2006
2.345
+0.773
49.22%
jan 1, 2007
6.517
+4.172
177.92%
jan 1, 2008
6.005
-0.512
-7.85%
jan 1, 2009
7.36
+1.354
22.55%
jan 1, 2010
8.366
+1.007
13.68%
jan 1, 2011
14.752
+6.386
76.33%
jan 1, 2012
17.476
+2.723
18.46%
jan 1, 2013
18.132
+0.657
3.76%
jan 1, 2014
21.418
+3.285
18.12%
jan 1, 2015
20.322
-1.096
-5.12%
jan 1, 2016
14.433
-5.889
-28.98%
Ranking of countries by current statistics by years