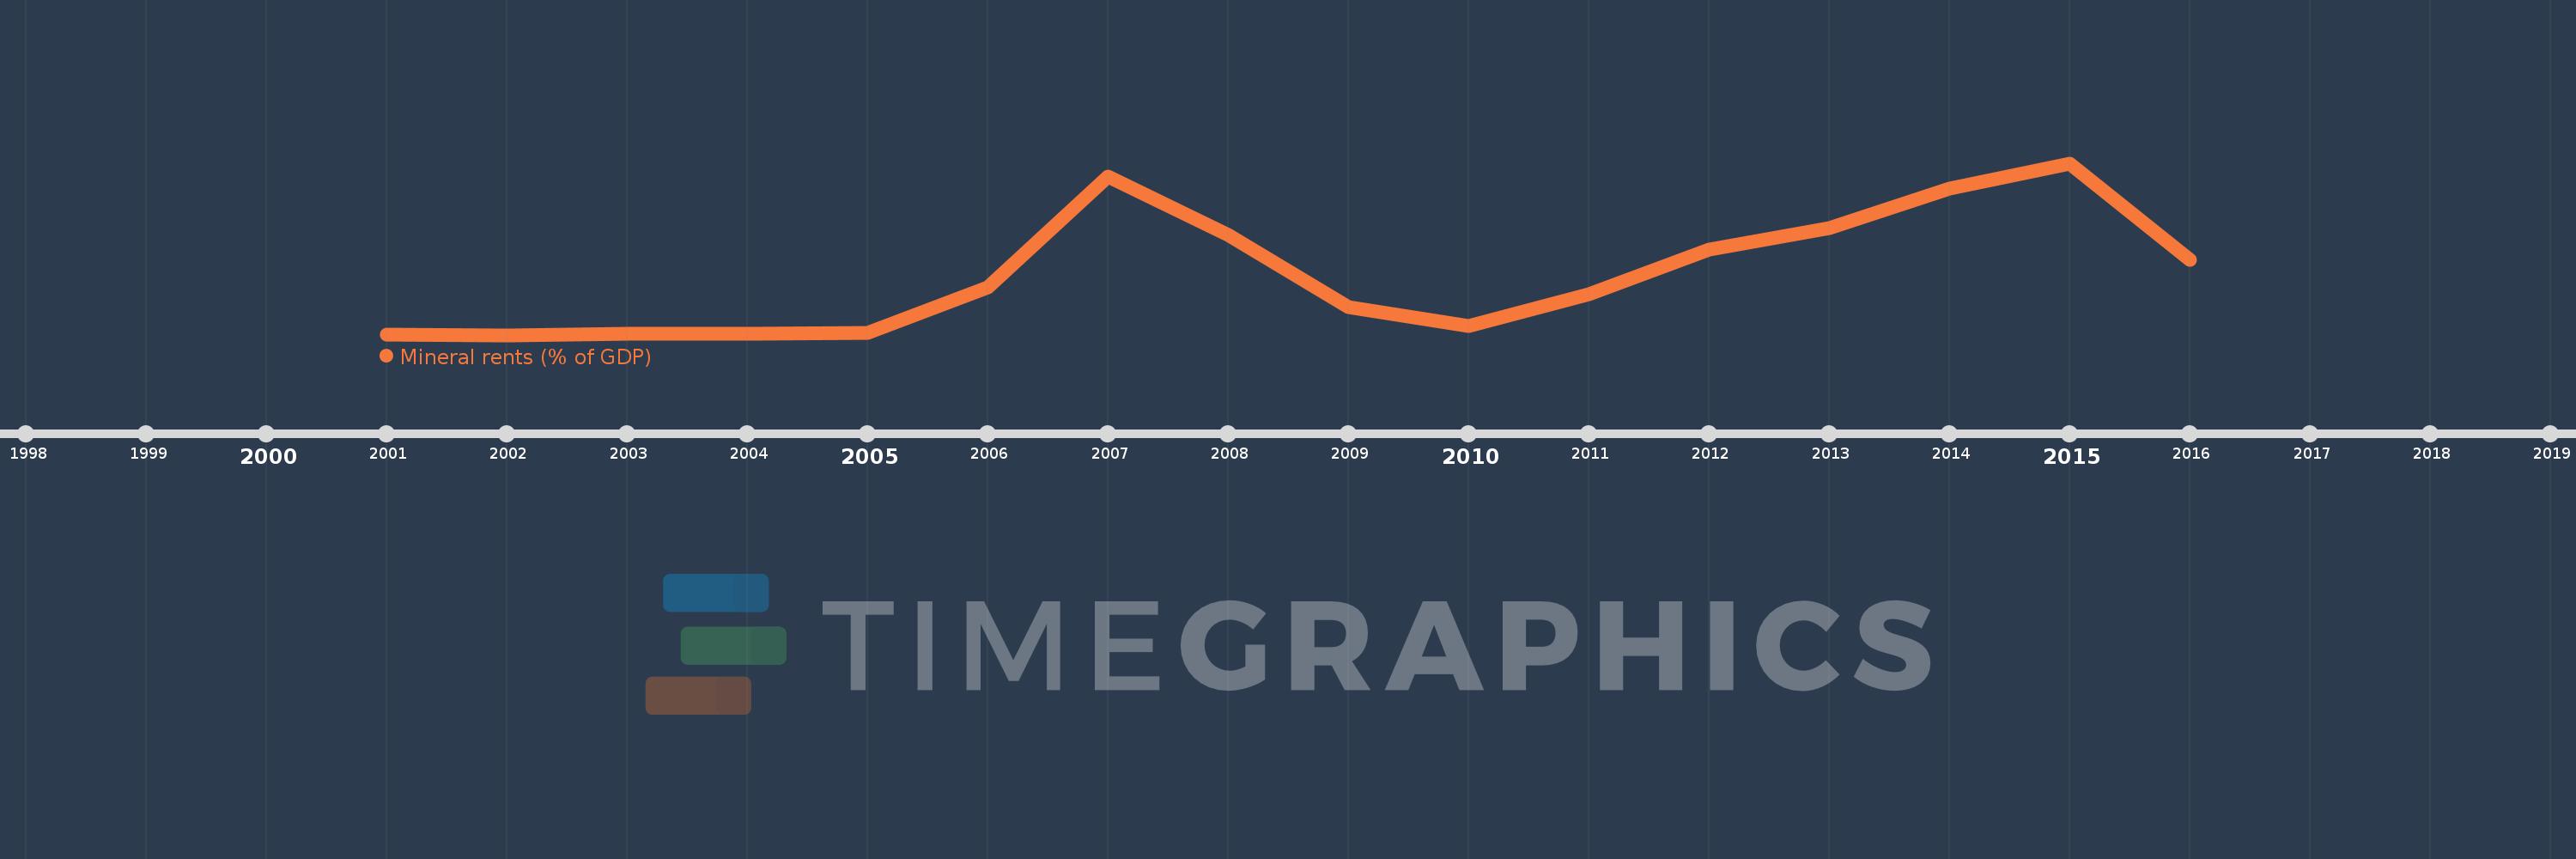
This timeline shows a graph from 2001 to 2016 of Myanmar. No data until 2000. Number of actual observations by date: 16.
Source name:
World Development Indicators
Source organization:
Estimates based on sources and methods described in "The Changing Wealth of Nations: Measuring Sustainable Development in the New Millennium" (World Bank, 2011).
Categories, topics:
Energy & Mining, Environment
Last updated:
apr 23, 2017
Indicators value changes by year
Meaning:
0.23
Minimum:
0.001
jan 1, 2002
Maximum:
0.649
jan 1, 2015
At the date of observation
Value
Absolute change
Change from the previous value
jan 1, 2001
0.002
+0.002
0.0%
jan 1, 2002
0.001
-0.001
-49.91%
jan 1, 2003
0.005
+0.004
540.26%
jan 1, 2004
0.005
+0.0
0.86%
jan 1, 2005
0.01
+0.005
92.41%
jan 1, 2006
0.181
+0.171
1.73K%
jan 1, 2007
0.598
+0.417
230.49%
jan 1, 2008
0.377
-0.222
-37.05%
jan 1, 2009
0.107
-0.27
-71.57%
jan 1, 2010
0.034
-0.073
-68.43%
jan 1, 2011
0.156
+0.122
360.48%
jan 1, 2012
0.324
+0.169
108.39%
jan 1, 2013
0.403
+0.078
24.15%
jan 1, 2014
0.554
+0.151
37.56%
jan 1, 2015
0.649
+0.095
17.17%
jan 1, 2016
0.283
-0.366
-56.4%
Ranking of countries by current statistics by years