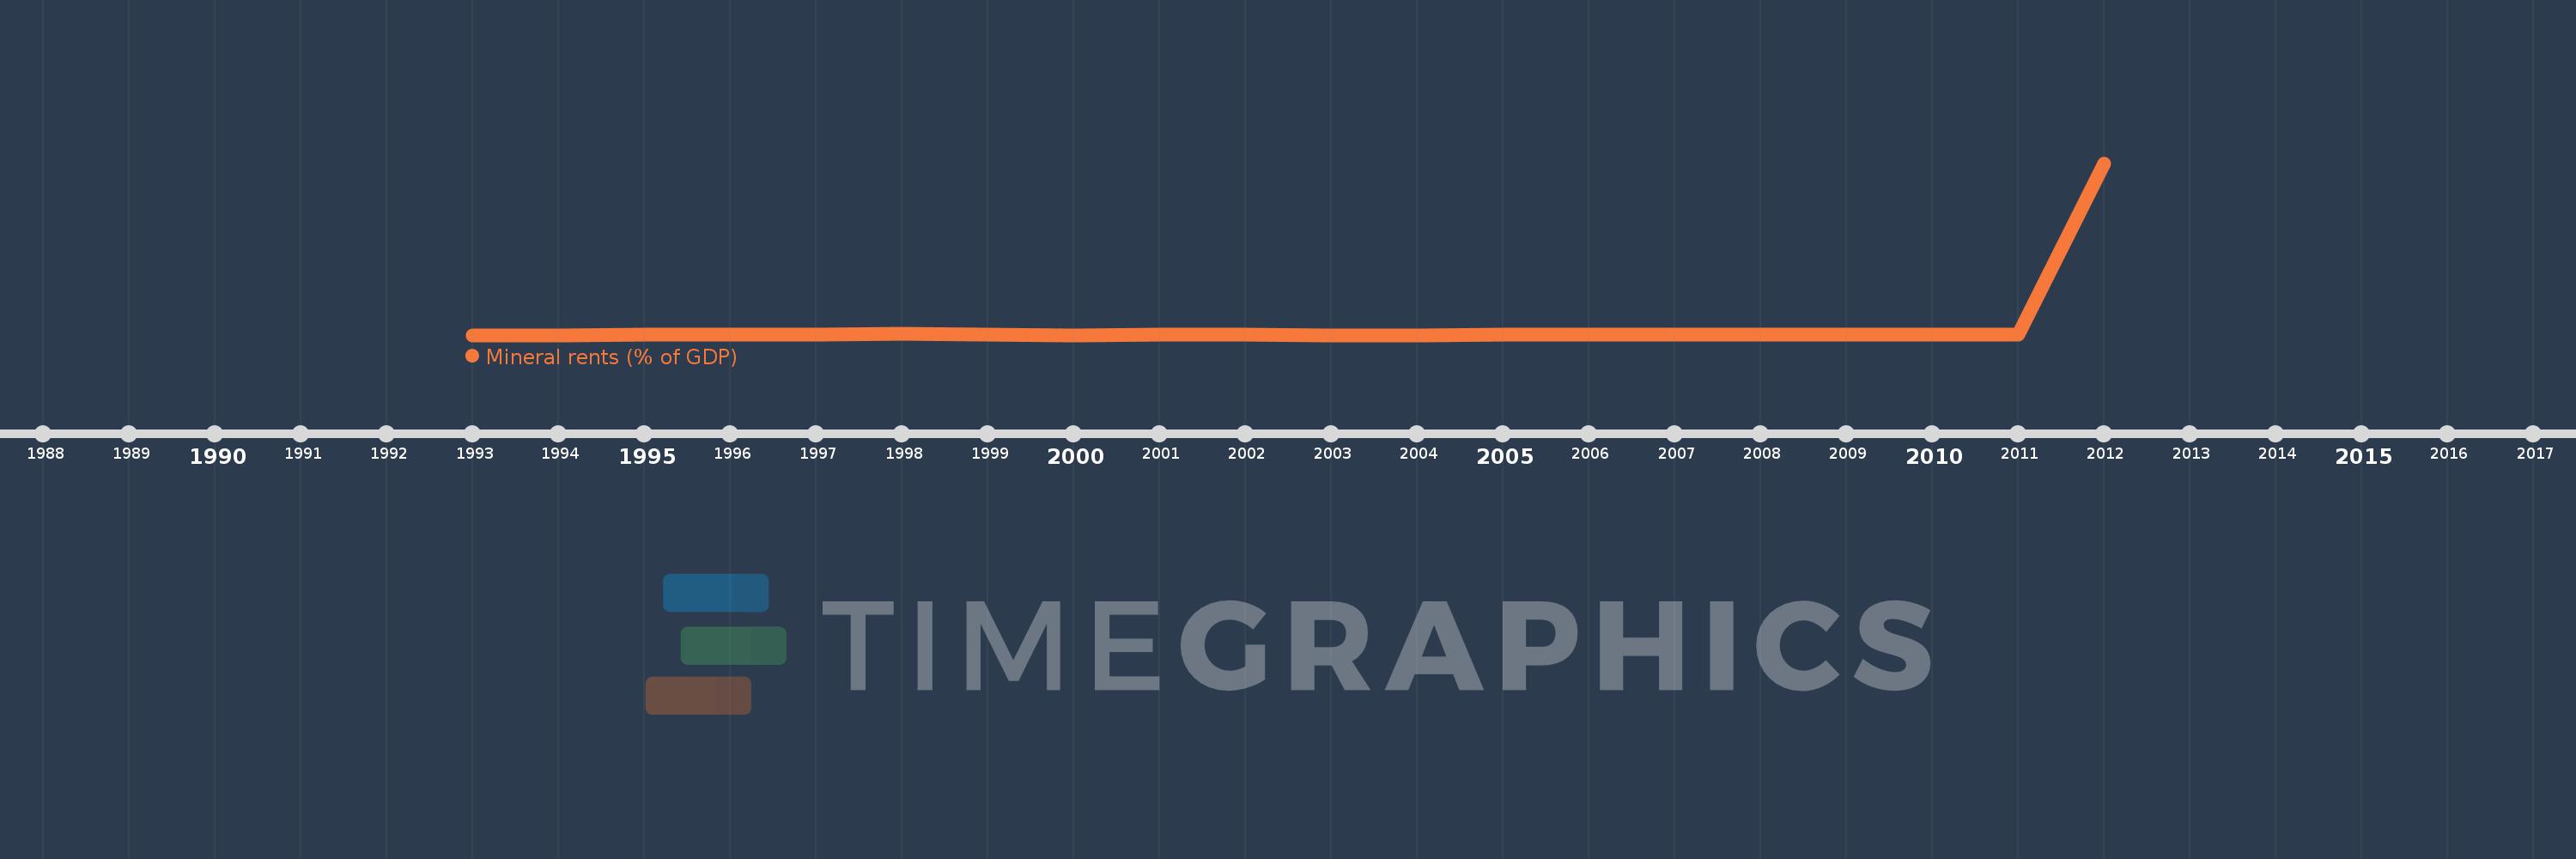
This timeline shows a graph from 1993 to 2012 of Eritrea. No data until 1992. Number of actual observations by date: 20.
Source name:
World Development Indicators
Source organization:
Estimates based on sources and methods described in "The Changing Wealth of Nations: Measuring Sustainable Development in the New Millennium" (World Bank, 2011).
Categories, topics:
Energy & Mining, Environment
Last updated:
apr 23, 2017
Indicators value changes by year
Meaning:
0.89
Minimum:
0.0
jan 1, 1993
Maximum:
17.373
jan 1, 2012
At the date of observation
Value
Absolute change
Change from the previous value
jan 1, 1993
0.0
0.0
0.0%
jan 1, 1994
0.0
0.0
%
jan 1, 1995
0.044
+0.044
%
jan 1, 1996
0.022
-0.023
-51.31%
jan 1, 1997
0.034
+0.013
58.64%
jan 1, 1998
0.096
+0.062
180.43%
jan 1, 1999
0.024
-0.072
-75.41%
jan 1, 2000
0.0
-0.024
-100.0%
jan 1, 2001
0.004
+0.004
%
jan 1, 2002
0.003
-0.002
-36.92%
jan 1, 2003
0.0
-0.003
-100.0%
jan 1, 2004
0.0
0.0
%
jan 1, 2005
0.011
+0.011
%
jan 1, 2006
0.012
+0.001
12.9%
jan 1, 2007
0.023
+0.011
88.26%
jan 1, 2008
0.027
+0.003
14.91%
jan 1, 2009
0.036
+0.009
34.44%
jan 1, 2010
0.033
-0.003
-7.88%
jan 1, 2011
0.067
+0.034
100.95%
jan 1, 2012
17.373
+17.307
25.95K%
Ranking of countries by current statistics by years