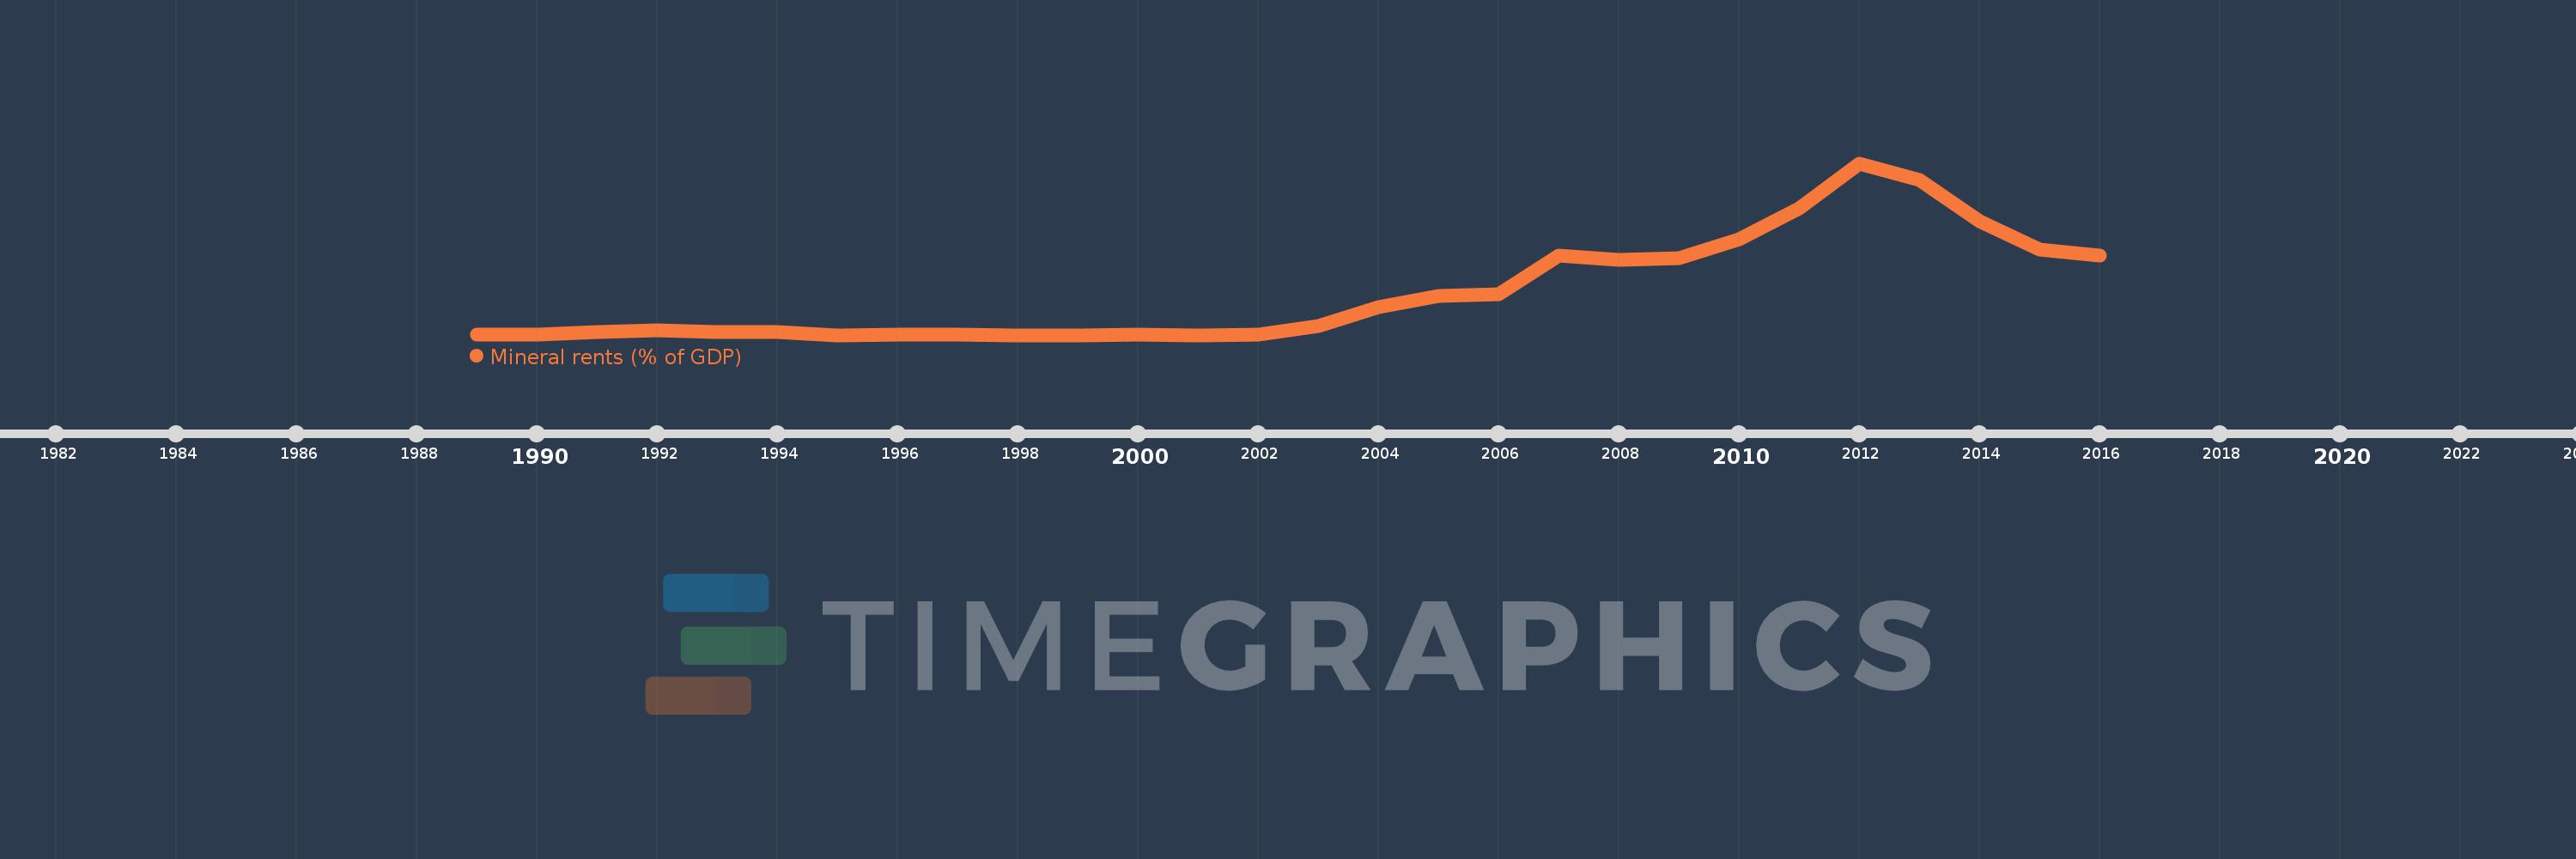
This timeline shows a graph from 1989 to 2016 of Tanzania. No data until 1988. Number of actual observations by date: 28.
Source name:
World Development Indicators
Source organization:
Estimates based on sources and methods described in "The Changing Wealth of Nations: Measuring Sustainable Development in the New Millennium" (World Bank, 2011).
Categories, topics:
Energy & Mining, Environment
Last updated:
apr 23, 2017
Indicators value changes by year
Meaning:
1.186
Minimum:
0.0
jan 1, 1995
Maximum:
4.792
jan 1, 2012
At the date of observation
Value
Absolute change
Change from the previous value
jan 1, 1989
0.004
+0.004
0.0%
jan 1, 1990
0.007
+0.003
67.56%
jan 1, 1991
0.084
+0.077
1.06K%
jan 1, 1992
0.125
+0.041
48.95%
jan 1, 1993
0.082
-0.044
-34.84%
jan 1, 1994
0.079
-0.003
-3.76%
jan 1, 1995
0.0
-0.079
-100.0%
jan 1, 1996
0.007
+0.007
%
jan 1, 1997
0.007
+0.0
4.54%
jan 1, 1998
0.0
-0.007
-94.73%
jan 1, 1999
0.0
0.0
-64.66%
jan 1, 2000
0.001
+0.001
729.35%
jan 1, 2001
0.0
-0.001
-78.74%
jan 1, 2002
0.009
+0.008
3.71K%
jan 1, 2003
0.247
+0.238
2.73K%
jan 1, 2004
0.775
+0.528
213.99%
jan 1, 2005
1.079
+0.304
39.27%
jan 1, 2006
1.148
+0.069
6.41%
jan 1, 2007
2.218
+1.07
93.21%
jan 1, 2008
2.088
-0.13
-5.86%
jan 1, 2009
2.141
+0.053
2.52%
jan 1, 2010
2.675
+0.534
24.93%
jan 1, 2011
3.533
+0.858
32.07%
jan 1, 2012
4.792
+1.259
35.64%
jan 1, 2013
4.315
-0.477
-9.95%
jan 1, 2014
3.186
-1.129
-26.16%
jan 1, 2015
2.394
-0.793
-24.88%
jan 1, 2016
2.226
-0.168
-7.02%
Ranking of countries by current statistics by years