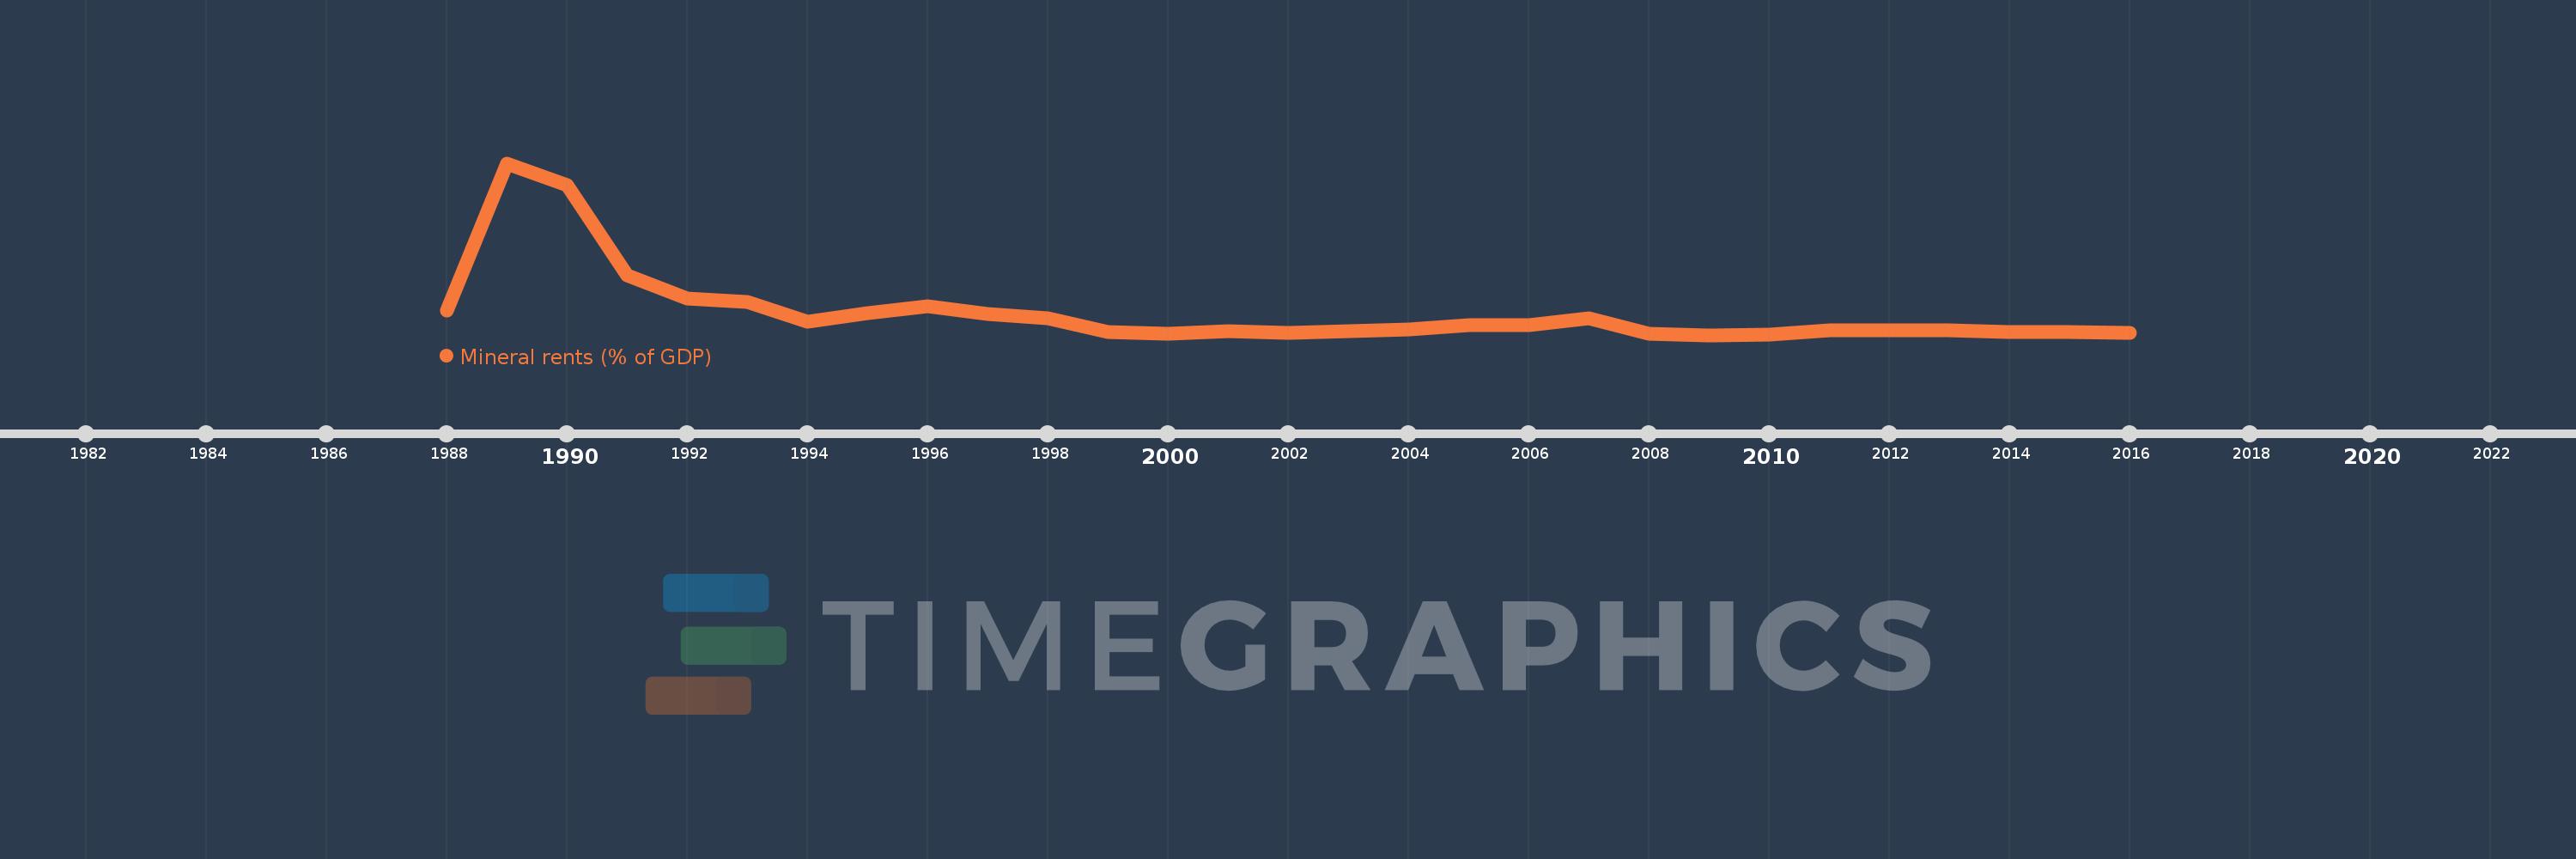
This timeline shows a graph from 1988 to 2016 of Romania. No data until 1987. Number of actual observations by date: 29.
Source name:
World Development Indicators
Source organization:
Estimates based on sources and methods described in "The Changing Wealth of Nations: Measuring Sustainable Development in the New Millennium" (World Bank, 2011).
Categories, topics:
Energy & Mining, Environment
Last updated:
apr 23, 2017
Indicators value changes by year
Meaning:
0.097
Minimum:
0.008
jan 1, 2009
Maximum:
0.68
jan 1, 1989
At the date of observation
Value
Absolute change
Change from the previous value
jan 1, 1988
0.105
+0.105
0.0%
jan 1, 1989
0.68
+0.575
548.82%
jan 1, 1990
0.593
-0.087
-12.73%
jan 1, 1991
0.243
-0.35
-59.01%
jan 1, 1992
0.152
-0.092
-37.7%
jan 1, 1993
0.139
-0.012
-8.21%
jan 1, 1994
0.061
-0.079
-56.47%
jan 1, 1995
0.094
+0.033
55.31%
jan 1, 1996
0.119
+0.025
26.42%
jan 1, 1997
0.092
-0.027
-22.35%
jan 1, 1998
0.073
-0.019
-20.51%
jan 1, 1999
0.019
-0.054
-73.5%
jan 1, 2000
0.012
-0.007
-36.57%
jan 1, 2001
0.023
+0.011
90.52%
jan 1, 2002
0.017
-0.006
-25.86%
jan 1, 2003
0.024
+0.006
35.59%
jan 1, 2004
0.031
+0.008
33.34%
jan 1, 2005
0.046
+0.015
47.41%
jan 1, 2006
0.047
+0.001
2.06%
jan 1, 2007
0.073
+0.026
54.14%
jan 1, 2008
0.014
-0.059
-80.59%
jan 1, 2009
0.008
-0.006
-41.71%
jan 1, 2010
0.009
+0.001
10.46%
jan 1, 2011
0.027
+0.018
196.12%
jan 1, 2012
0.027
0.0
-1.0%
jan 1, 2013
0.028
+0.001
4.44%
jan 1, 2014
0.02
-0.008
-26.98%
jan 1, 2015
0.019
-0.002
-7.99%
jan 1, 2016
0.017
-0.002
-8.34%
Ranking of countries by current statistics by years