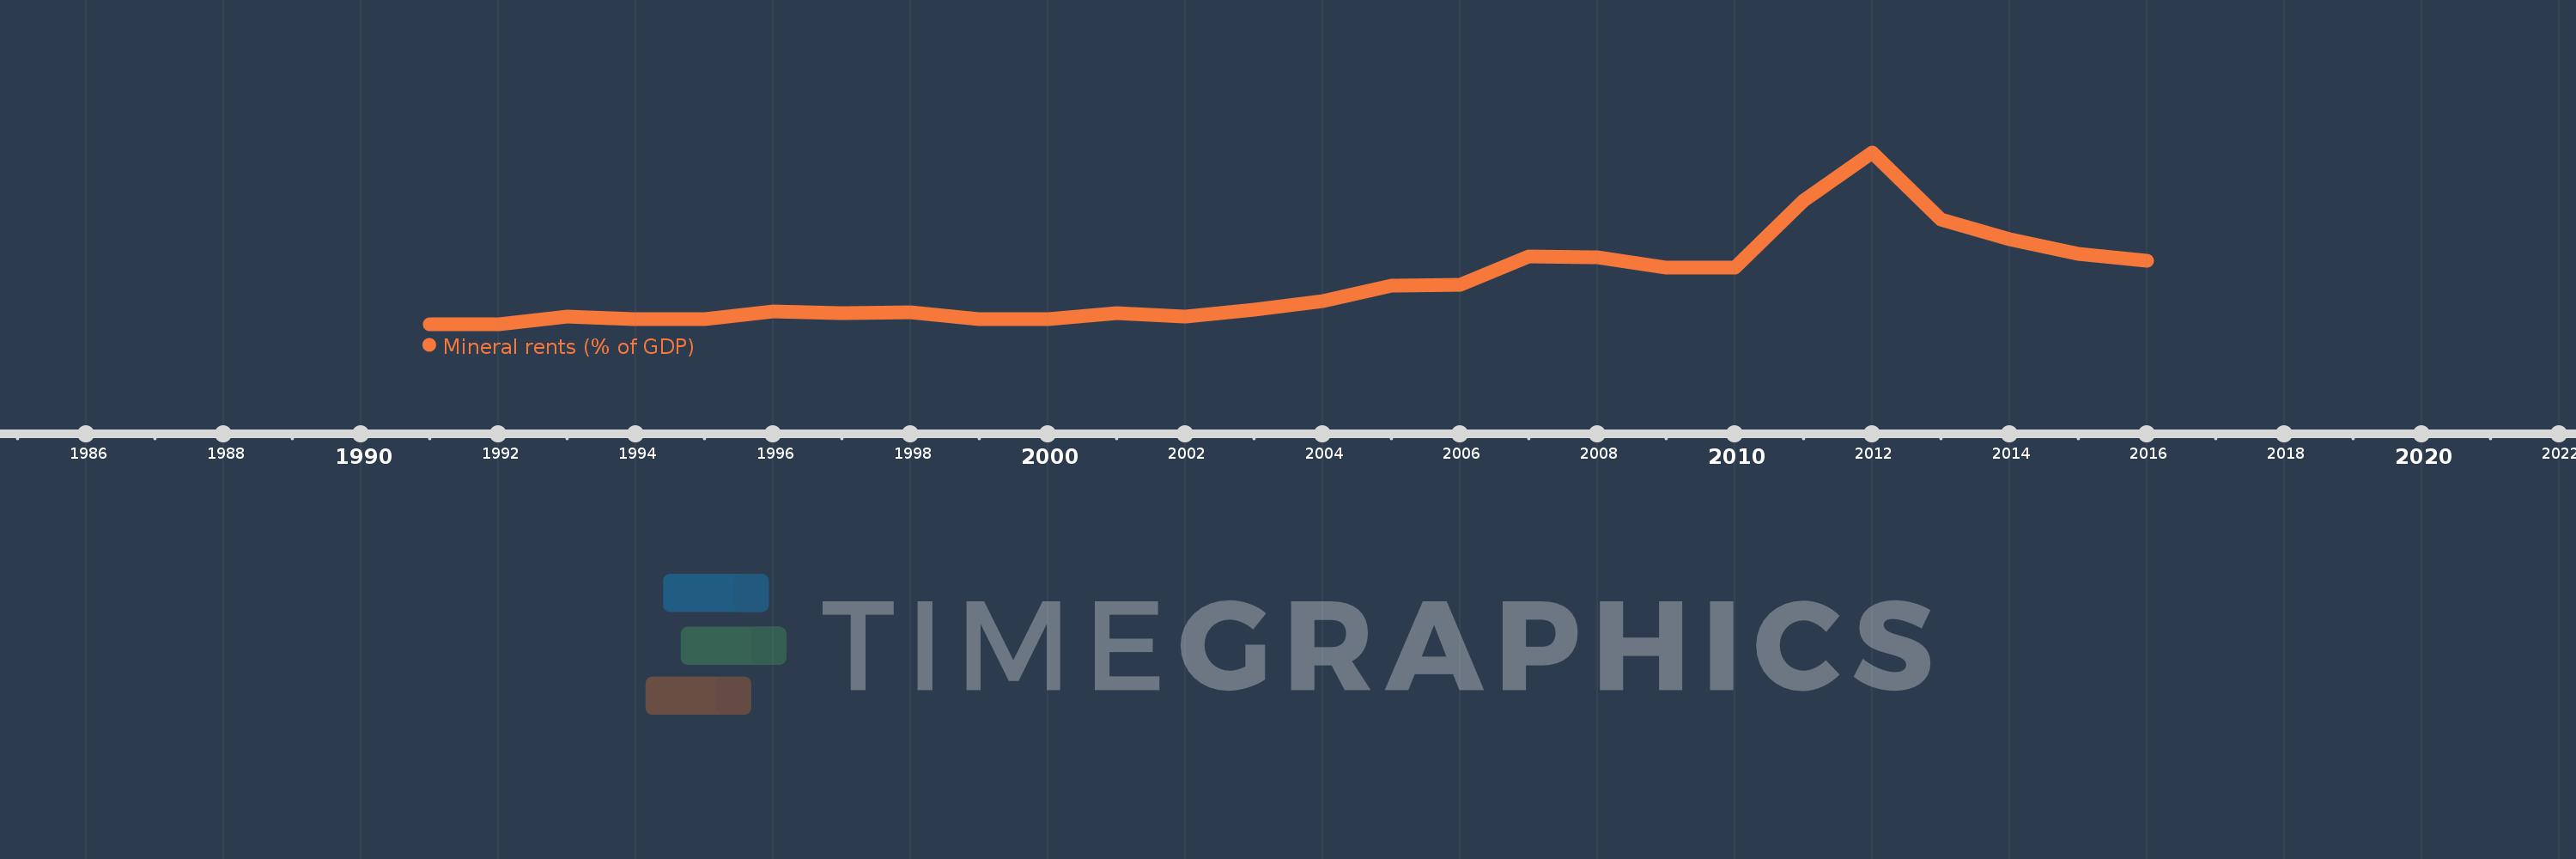
This timeline shows a graph from 1991 to 2016 of Georgia. No data until 1990. Number of actual observations by date: 26.
Source name:
World Development Indicators
Source organization:
Estimates based on sources and methods described in "The Changing Wealth of Nations: Measuring Sustainable Development in the New Millennium" (World Bank, 2011).
Categories, topics:
Energy & Mining, Environment
Last updated:
apr 23, 2017
Indicators value changes by year
Meaning:
0.518
Minimum:
0.0
jan 1, 1991
Maximum:
2.177
jan 1, 2012
At the date of observation
Value
Absolute change
Change from the previous value
jan 1, 1991
0.0
0.0
0.0%
jan 1, 1992
0.0
0.0
%
jan 1, 1993
0.097
+0.097
%
jan 1, 1994
0.065
-0.033
-33.53%
jan 1, 1995
0.06
-0.004
-6.41%
jan 1, 1996
0.161
+0.101
166.61%
jan 1, 1997
0.138
-0.023
-14.17%
jan 1, 1998
0.152
+0.014
10.26%
jan 1, 1999
0.059
-0.093
-61.11%
jan 1, 2000
0.067
+0.007
12.5%
jan 1, 2001
0.145
+0.078
117.17%
jan 1, 2002
0.095
-0.05
-34.41%
jan 1, 2003
0.188
+0.093
98.27%
jan 1, 2004
0.288
+0.1
52.9%
jan 1, 2005
0.494
+0.207
71.72%
jan 1, 2006
0.496
+0.001
0.29%
jan 1, 2007
0.858
+0.362
73.08%
jan 1, 2008
0.849
-0.009
-1.04%
jan 1, 2009
0.72
-0.13
-15.25%
jan 1, 2010
0.713
-0.007
-0.94%
jan 1, 2011
1.561
+0.848
118.91%
jan 1, 2012
2.177
+0.617
39.5%
jan 1, 2013
1.322
-0.855
-39.28%
jan 1, 2014
1.073
-0.25
-18.88%
jan 1, 2015
0.892
-0.181
-16.87%
jan 1, 2016
0.806
-0.086
-9.65%
Ranking of countries by current statistics by years