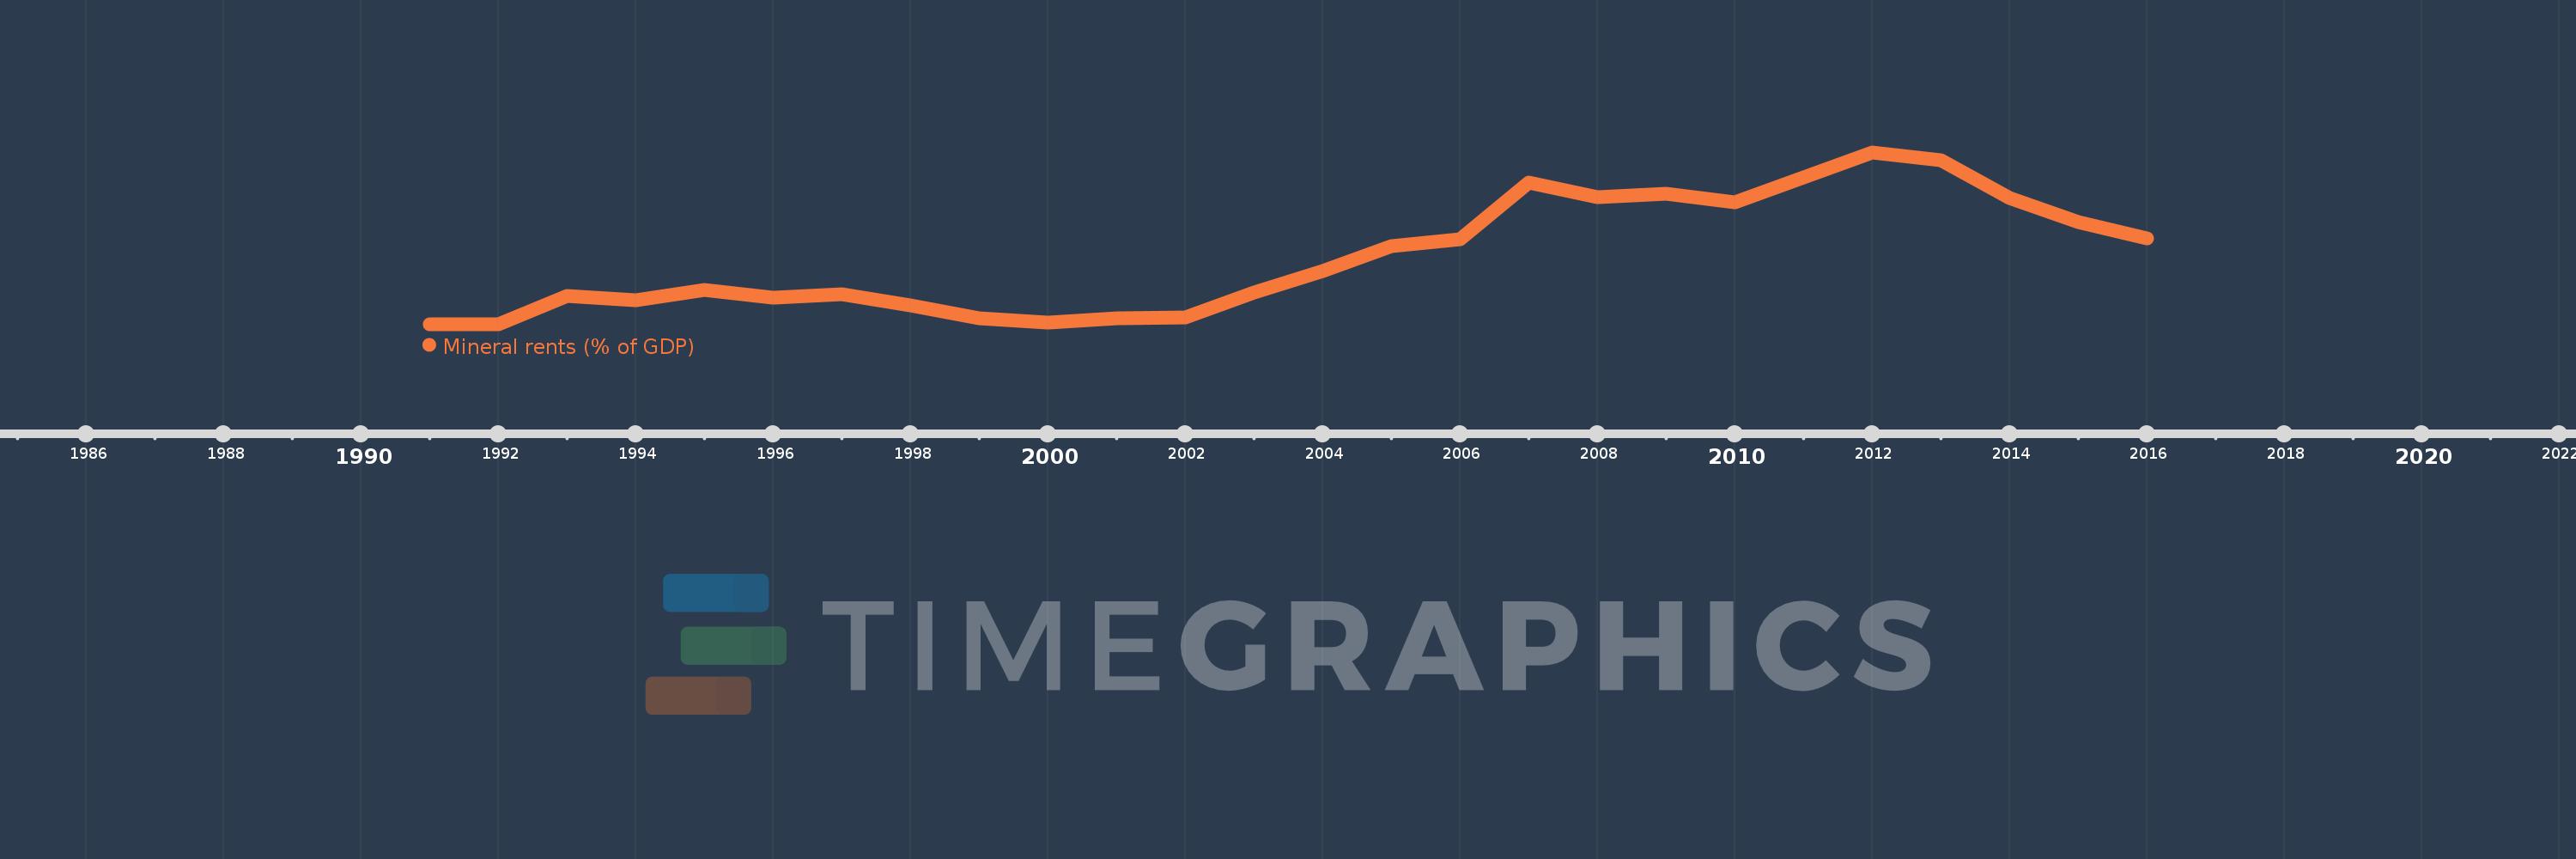
This timeline shows a graph from 1991 to 2016 of Uzbekistan. No data until 1990. Number of actual observations by date: 26.
Source name:
World Development Indicators
Source organization:
Estimates based on sources and methods described in "The Changing Wealth of Nations: Measuring Sustainable Development in the New Millennium" (World Bank, 2011).
Categories, topics:
Energy & Mining, Environment
Last updated:
apr 23, 2017
Indicators value changes by year
Meaning:
3.643
Minimum:
0.0
jan 1, 1991
Maximum:
9.304
jan 1, 2012
At the date of observation
Value
Absolute change
Change from the previous value
jan 1, 1991
0.0
0.0
0.0%
jan 1, 1992
0.0
0.0
%
jan 1, 1993
1.534
+1.534
%
jan 1, 1994
1.311
-0.223
-14.52%
jan 1, 1995
1.877
+0.566
43.17%
jan 1, 1996
1.442
-0.435
-23.19%
jan 1, 1997
1.634
+0.192
13.33%
jan 1, 1998
1.04
-0.594
-36.35%
jan 1, 1999
0.303
-0.737
-70.84%
jan 1, 2000
0.101
-0.202
-66.68%
jan 1, 2001
0.335
+0.234
231.36%
jan 1, 2002
0.371
+0.036
10.77%
jan 1, 2003
1.703
+1.332
359.13%
jan 1, 2004
2.892
+1.189
69.8%
jan 1, 2005
4.21
+1.318
45.59%
jan 1, 2006
4.588
+0.378
8.97%
jan 1, 2007
7.655
+3.067
66.85%
jan 1, 2008
6.897
-0.758
-9.9%
jan 1, 2009
7.047
+0.15
2.17%
jan 1, 2010
6.614
-0.433
-6.15%
jan 1, 2011
7.945
+1.331
20.12%
jan 1, 2012
9.304
+1.359
17.1%
jan 1, 2013
8.892
-0.413
-4.43%
jan 1, 2014
6.83
-2.062
-23.19%
jan 1, 2015
5.554
-1.276
-18.68%
jan 1, 2016
4.642
-0.911
-16.41%
Ranking of countries by current statistics by years