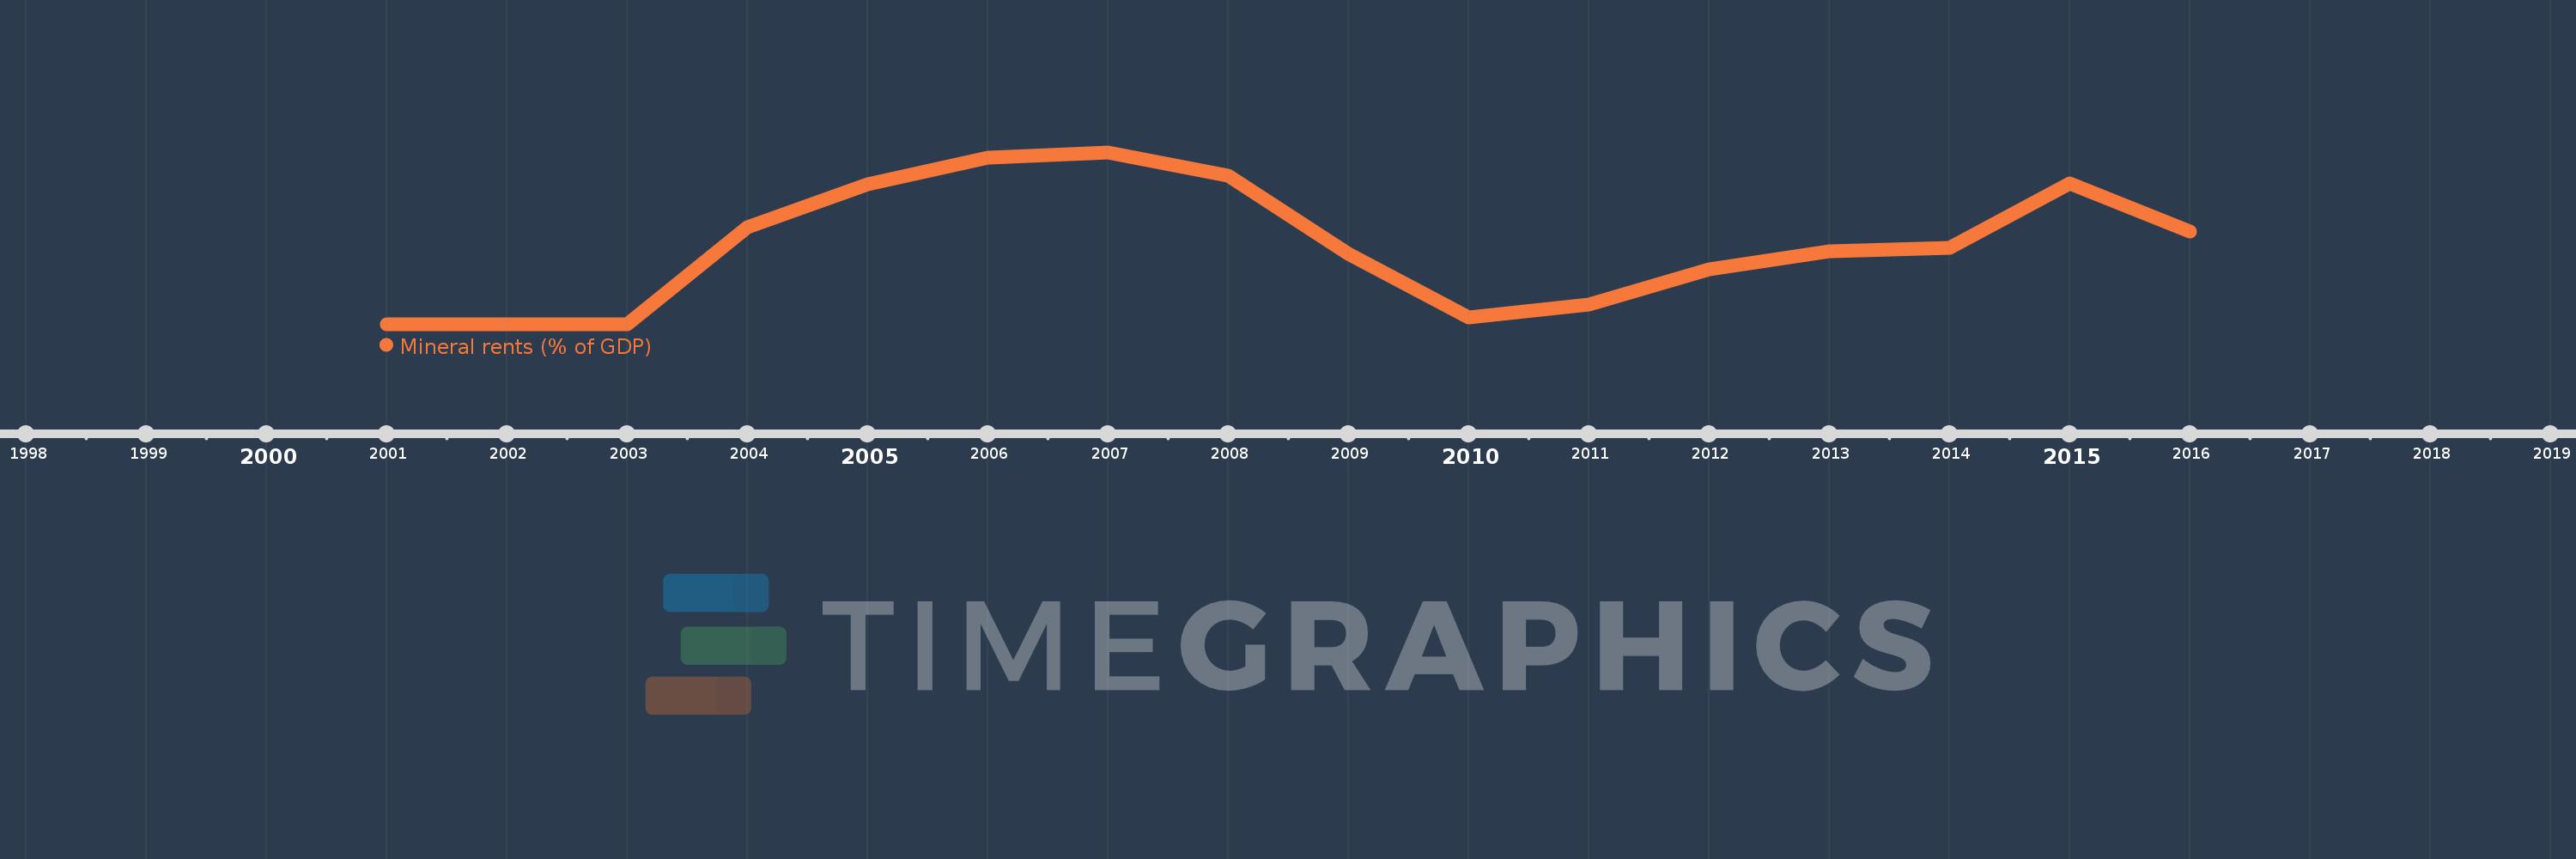
This timeline shows a graph from 2001 to 2016 of Montenegro. No data until 2000. Number of actual observations by date: 16.
Source name:
World Development Indicators
Source organization:
Estimates based on sources and methods described in "The Changing Wealth of Nations: Measuring Sustainable Development in the New Millennium" (World Bank, 2011).
Categories, topics:
Energy & Mining, Environment
Last updated:
apr 23, 2017
Indicators value changes by year
Meaning:
0.144
Minimum:
0.0
jan 1, 2001
Maximum:
0.314
jan 1, 2007
At the date of observation
Value
Absolute change
Change from the previous value
jan 1, 2001
0.0
0.0
0.0%
jan 1, 2002
0.0
0.0
%
jan 1, 2003
0.0
0.0
%
jan 1, 2004
0.177
+0.177
%
jan 1, 2005
0.255
+0.079
44.44%
jan 1, 2006
0.305
+0.049
19.32%
jan 1, 2007
0.314
+0.01
3.17%
jan 1, 2008
0.271
-0.043
-13.66%
jan 1, 2009
0.129
-0.142
-52.46%
jan 1, 2010
0.013
-0.116
-89.93%
jan 1, 2011
0.036
+0.023
178.21%
jan 1, 2012
0.1
+0.064
177.78%
jan 1, 2013
0.134
+0.034
33.47%
jan 1, 2014
0.14
+0.006
4.48%
jan 1, 2015
0.258
+0.118
84.25%
jan 1, 2016
0.17
-0.088
-34.04%
Ranking of countries by current statistics by years